
|
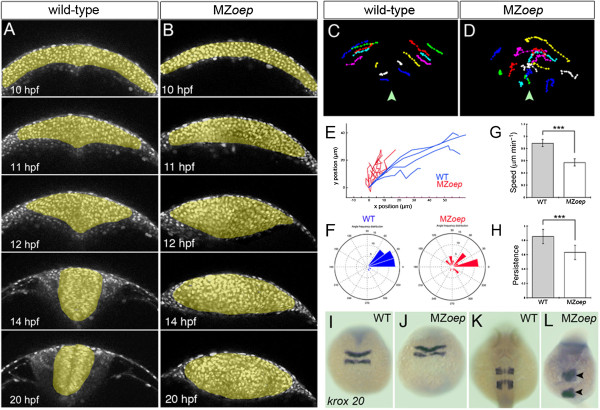
Fig. 8
Neural cell movements in MZoep embryos are highly disrupted through neural keel to neural tube stages. (A,B) Selected frames from time-lapse sequences showing normal neurulation in a wild-type embryo and disrupted neurulation in a MZoep embryo from 12 hpf. Cells are labeled with H2B-RFP to reveal movements of nuclei (gray). (C,D) Tracks of individual neural cell nuclei in wild-type and MZoep embryos at hindbrain level. Midline is marked with arrowhead. (E) Trajectory plots of cells in wild-type and MZoep hindbrain primordia. (F) Directionality plots for cells in wild-type and MZoep neural plates. (G,H) Speed and persistence of neural cell movements are disrupted from 12 hpf onwards in MZoep embryos (linear speed µm/min: wild-type cells 0.87 versus MZoep cells 0.56, ***P <0.0001 Student’s t-test; persistence: wild-type cells 0.85 versus MZoep cells 0.63, ***P <0.0002 Student’s t-test). (I,J,K,L) The hindbrain marker krox20 shows that the anterior-posterior pattern in hindbrain region is only mildly disrupted despite abnormal cell movements in MZoep neural primordia. H2B-RFP, histone H2B/red fluorescent protein fusion; hpf, hours post fertilization; MZoep, maternal-zygotic one-eyed pinhead; wt, wild-type.