
|
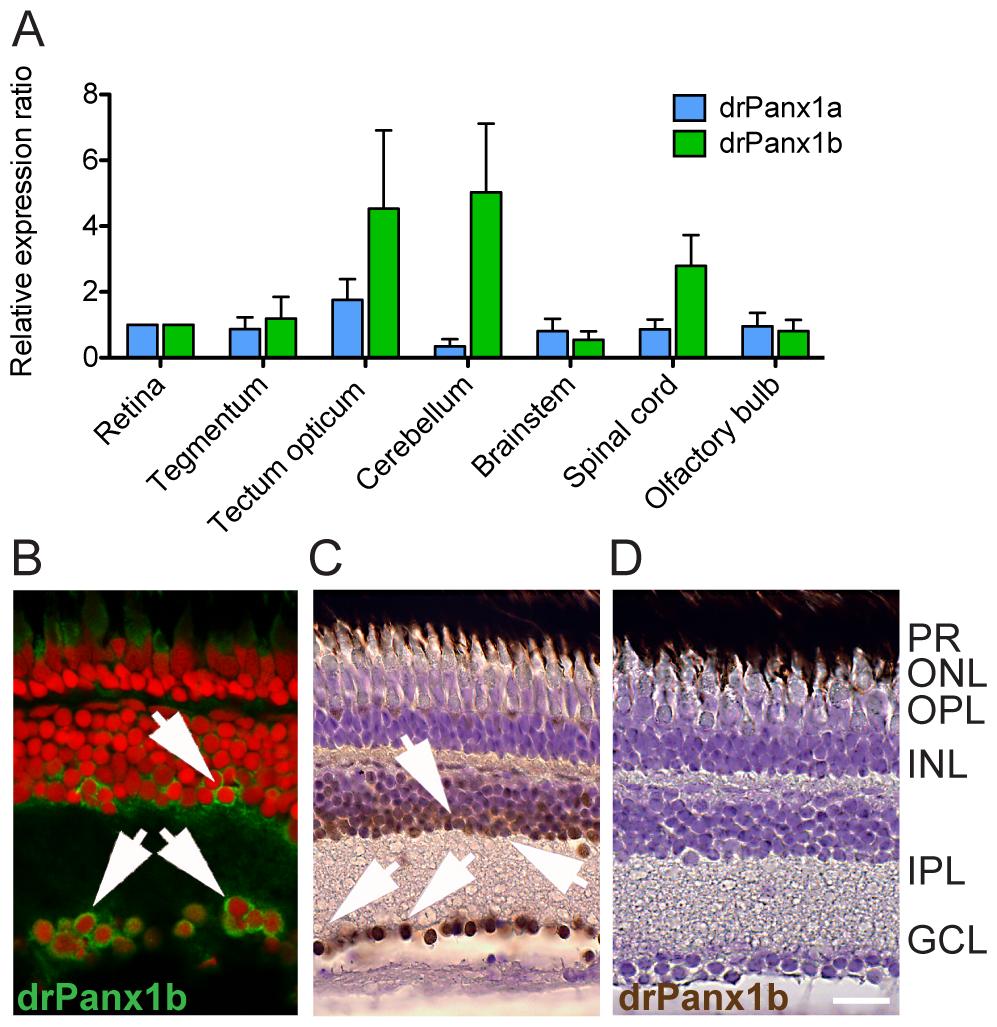
Fig. 2 (A) qRT-PCR analysis of drPanx1 expression. Total RNA was isolated from several CNS regions of adult zebrafish und used for cDNA synthesis. Retinal drPanx1 expression was normalized to 1. Each bar represents the mean + SEM. (n = 3) (B-D) IHC/DAB staining of drPanx1b expression in the retina. The anti-drPanx1b antibody was used as primary antibody. Cell bodies were stained with propidium iodide (red; B) or cresyl violet (violet; C, D). Arrows point at drPanx1b positive cells in the INL and GCL. (B) The primary antibody was visualized by an anti-chicken antibody conjugated with Alexa488. (C, D) For DAB staining, a biotinylated anti-chicken antibody served as detection antibody. (D) Control staining using the immunizing blocking peptide together with the anti-drPanx1b antibody. (Scale bar (B-D) = 10 µm; GCL = ganglion cell layer; INL = inner nuclear layer; IPL = inner plexiform layer; ONL = outer nuclear layer; OPL = outer plexiform layer; PR = photoreceptors).