
|
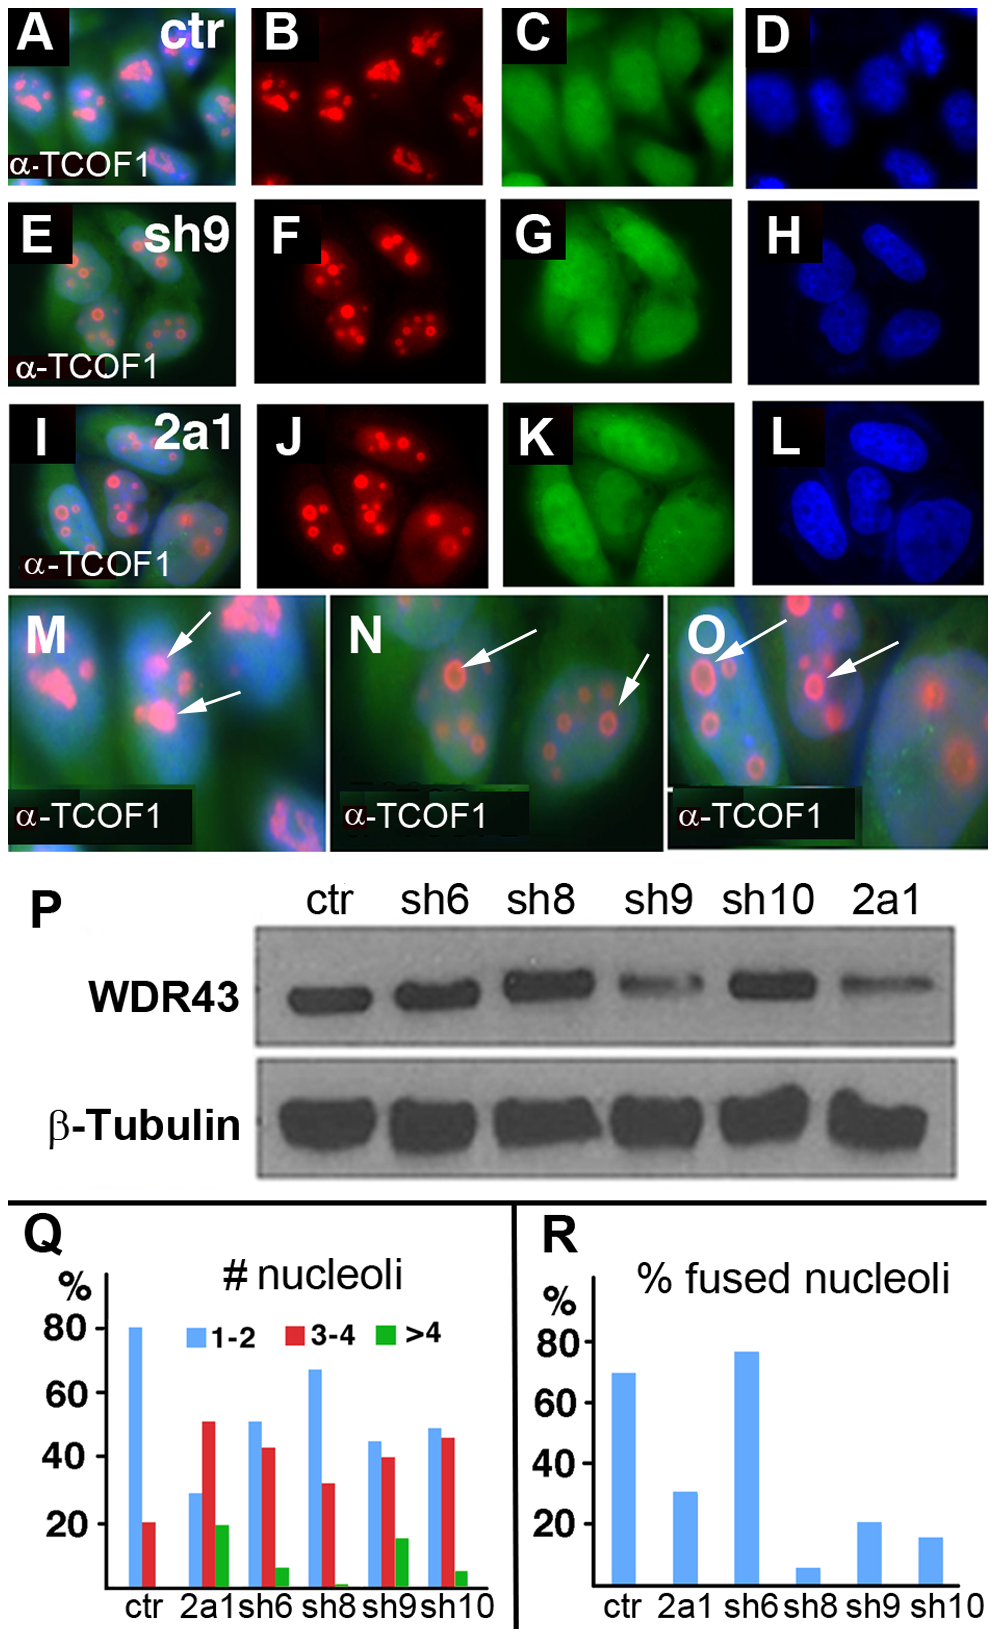
Fig. 8
TCOF1 expression in stable WDR43 shRNA cell lines.
(A–O) IF analysis of TCOF1 (red) localization in control shRNA (A–D, M) and human WDR43 shRNA (E–L, N, O) stable HeLa cell lines. All cells were positive for shRNA expression (green) and DAPI stained nuclei (blue). (P) Western blot analyses of WDR43 expression in stable WDR43 shRNA cell lines. (Q–R) Quantification of TCOF1 positive nucleoli per cell (Q), and percent cells with fused TCOF1 positive nucleoli (R), in control and WDR43 shRNA stable lines. The number of nucleoli was increased (Q), and the percentage of fused nucleoli was reduced (R) in WDR43 depleted cells, as compared to control cells. Sample numbers: Panel Q - ctr 290, 2a1 136, sh6 195, sh8 172, sh9 172, sh10 108; Panel R – ctr 268, 2a1 115, sh6 181, sh8 163, sh9 171, sh10 108.