
|
Fig. 4
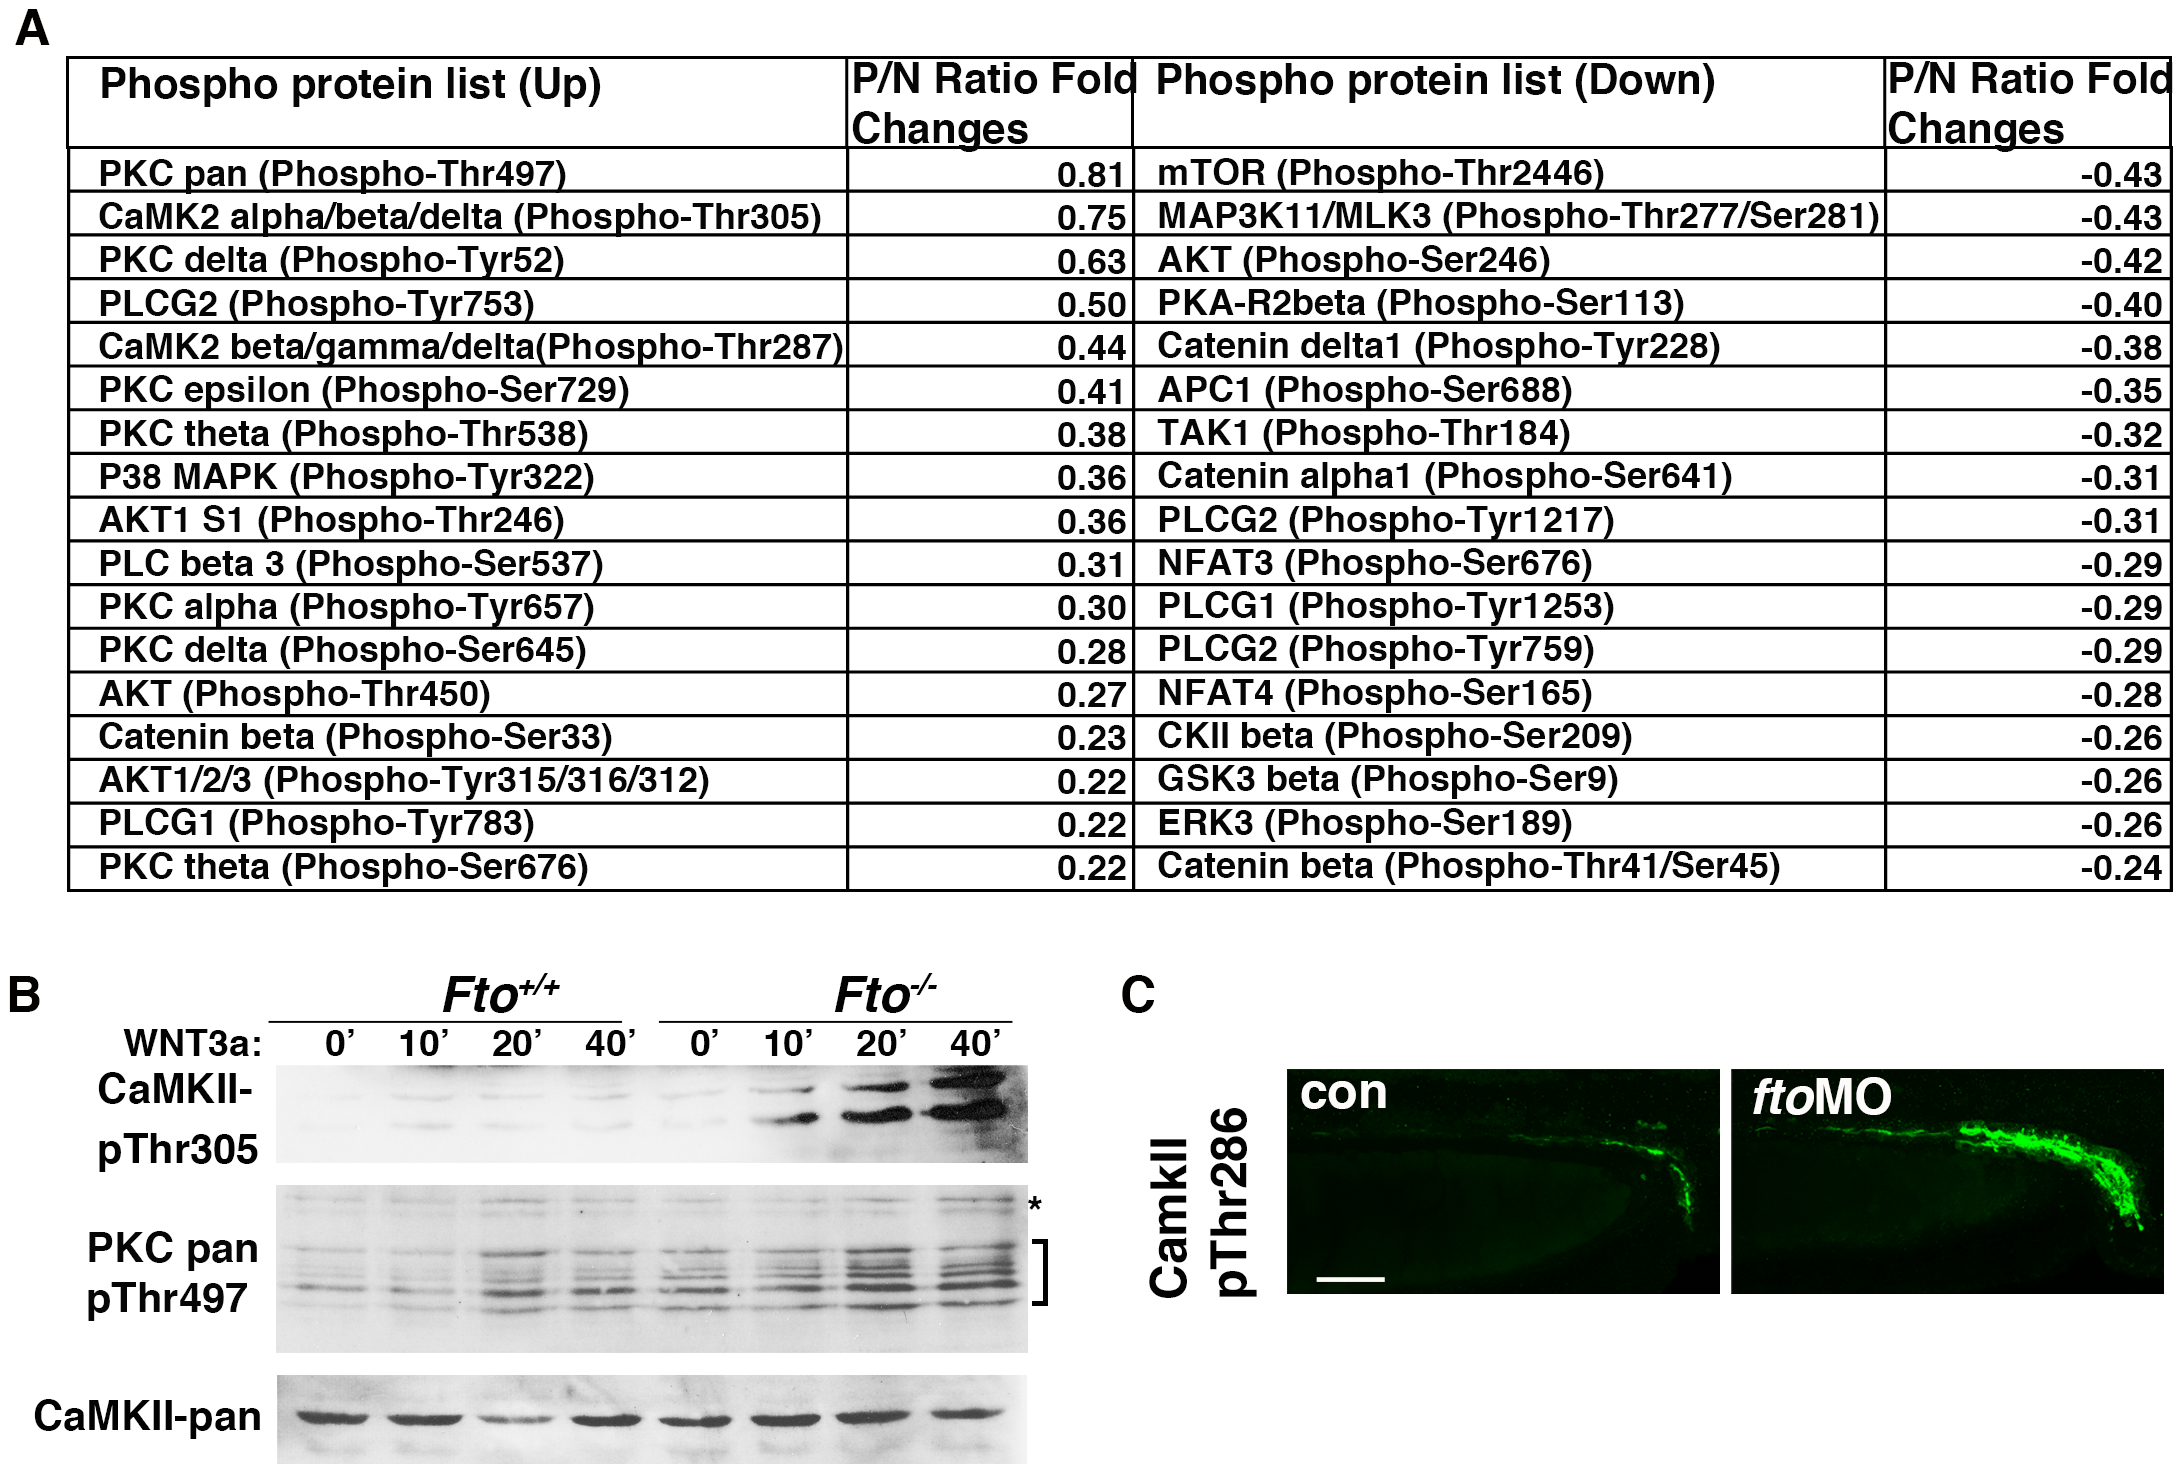
Ca2+/Wnt signaling is activated in Fto deficient cells and zebrafish.
(A) Wnt signaling phospho antibody microarray.Control (Fto+/+) and Fto knockout (Fto/) MEFs were treated with Wnt3a and changes in phosphorylation of Wnt signaling proteins analysed by an antibody microarray. P/N: Phospho-Antibody/Non-Phospho-Antibody ratio. For detailed calculations see Methods. (B) Total CamKII, phosphorylated (Thr305) CaMKII, and pan phosphorylated PKC (Thr497) were analysed in control (Fto+/+) and Fto knockout (Fto/) MEFs treated with Wnt3a conditioned medium (+) for 0, 10, 20 and 40 minutes. Brackets indicate PKC isoforms, asterisks show a non-specific band. (C) Phosphorylated CaMKII (Thr287) is upregulated in the pronephric ducts (PND) of fto morphant embryos compared to uninjected controls, as shown by immunofluorescence at 48 hpf. Scale bar: 50 μm.