
Image
|
Figure Caption
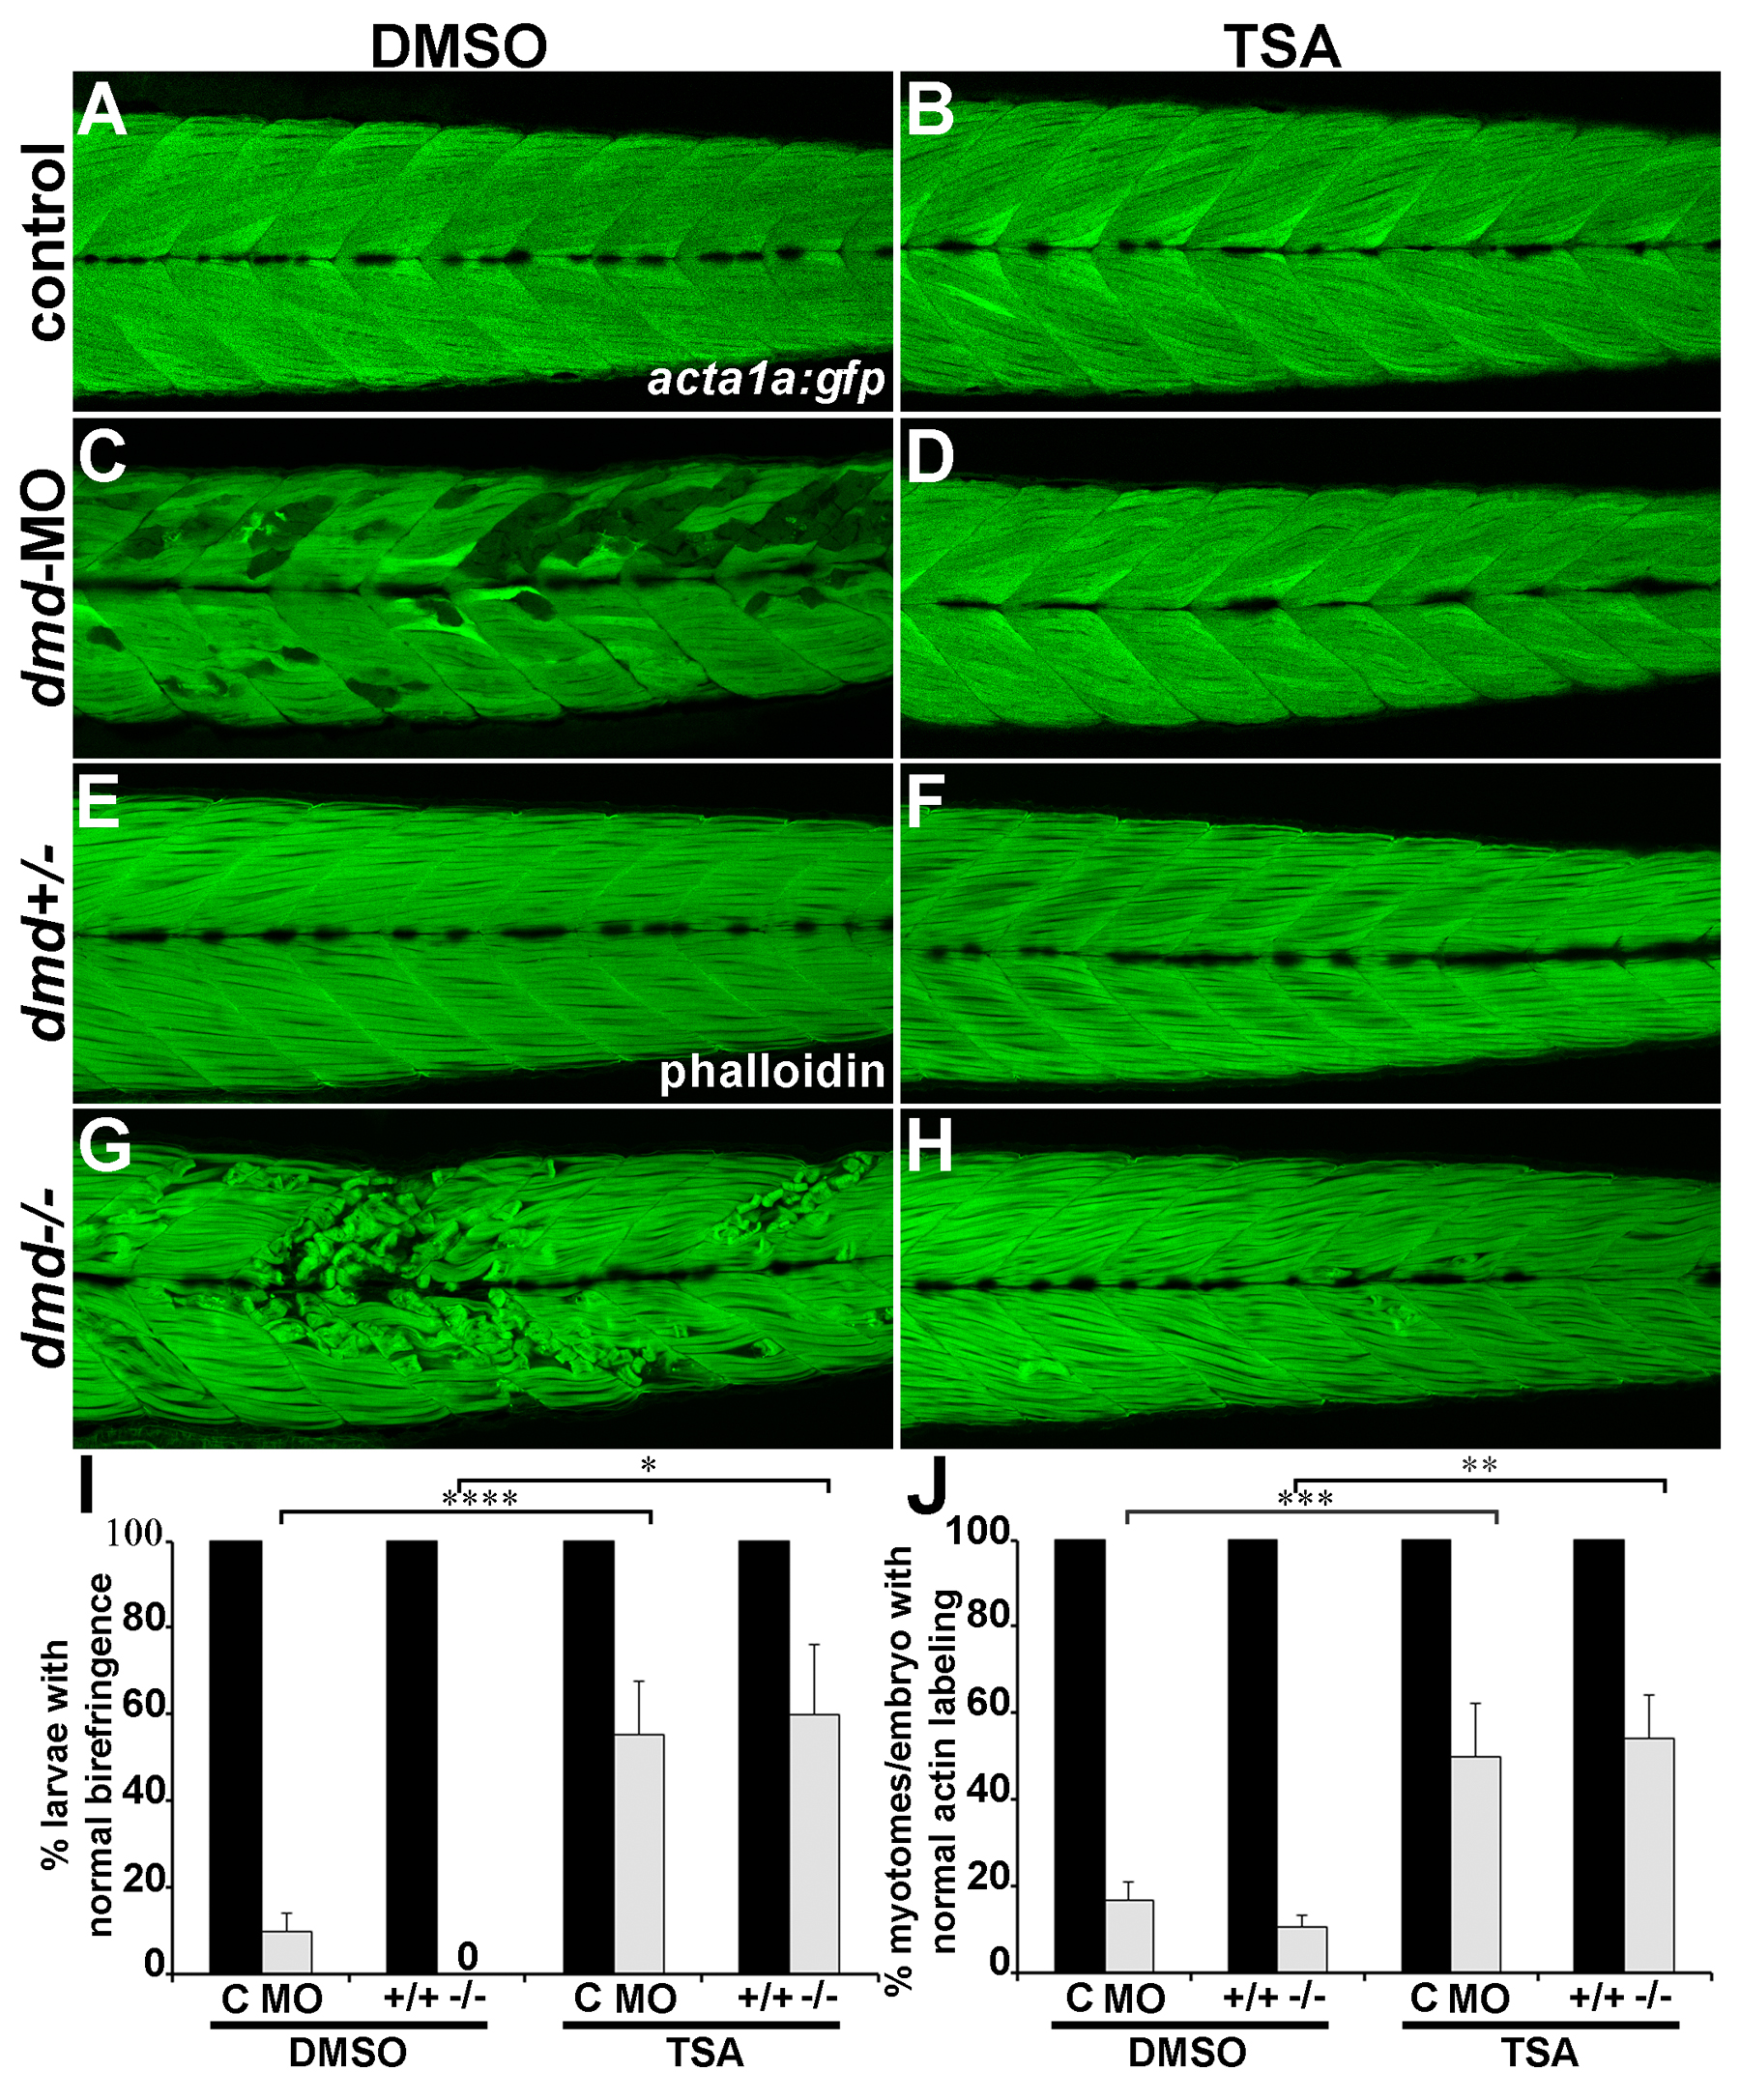
Fig. 5
Treatment with TSA rescues dmd-MO and dmd mutant muscle lesions.
(A-D) acta1a:gfpexpression. (E-H) phalloidin staining. Lateral views of trunk somites show anterior to the left. (I-J) Quantification of larval birefringence and actin labeling patterns. For control/dmd-MO treatments, for each bar, n=6 with e10 larvae for each replicate. For dmd+/+/dmd-/-treatments, for each bar, n=3 with e8 larvae for each replicate. * P<0.03. ** P<0.02. *** P<0.009. **** P<0.002. All larvae from dmd crosses were genotyped.
Figure Data
Acknowledgments
This image is the copyrighted work of the attributed author or publisher, and
ZFIN has permission only to display this image to its users.
Additional permissions should be obtained from the applicable author or publisher of the image.
Full text @ PLoS Curr.