
Image
|
Figure Caption
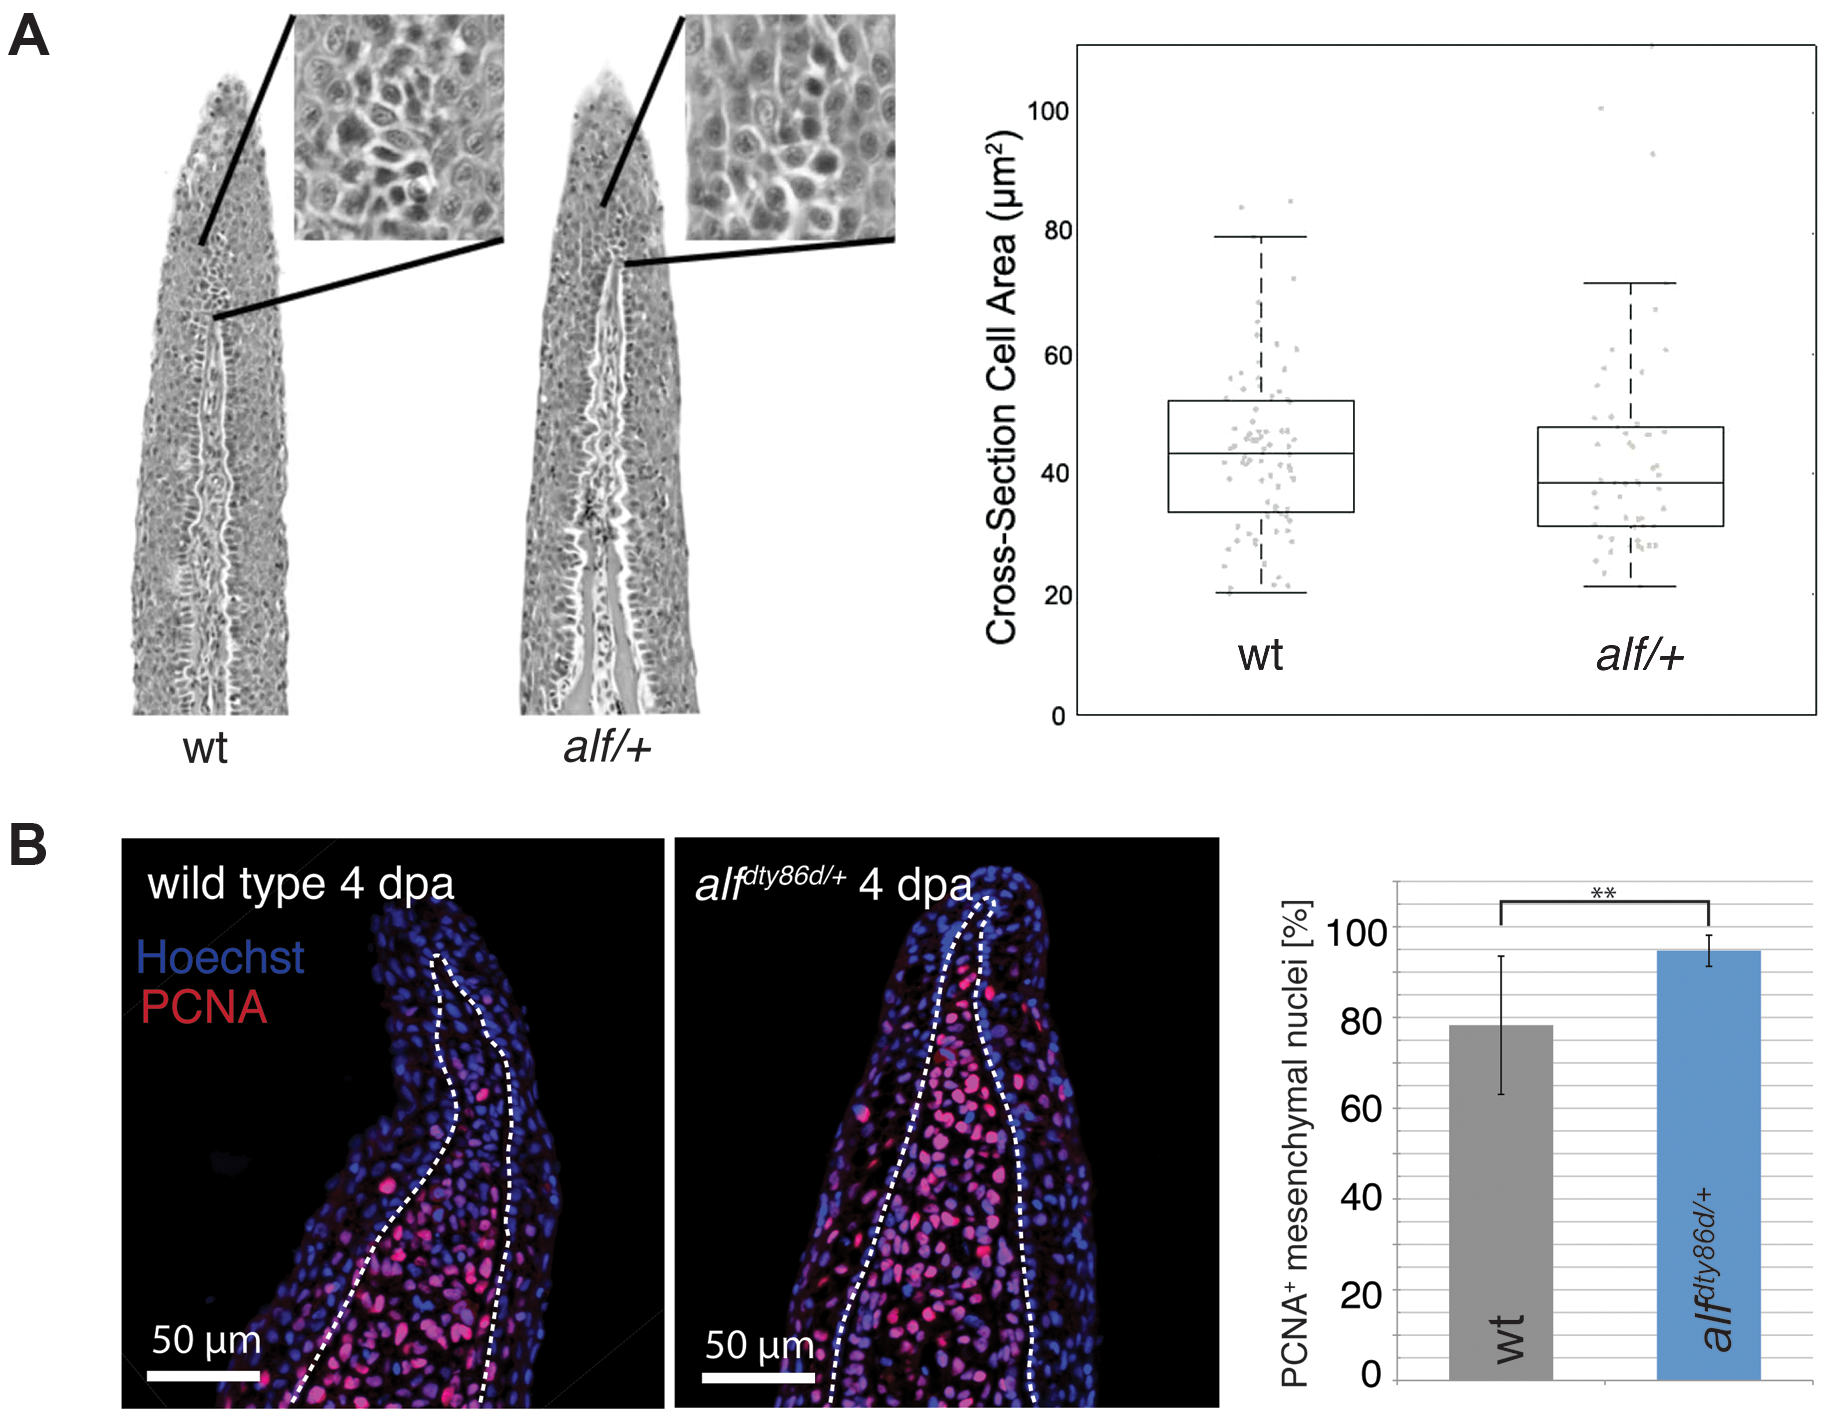
Fig. 2
Cell proliferation is increased in alf mutants.
(A) Sections of wild type and heterozygous alf fins. No significant difference in cell size is seen in the two groups. (B) Antibody staining against PCNA on paraffin sections of regenerating fins 4 days post amputation (dpa). Chart shows percentage of proliferating nuclei (PCNA) over total nuclei (Hoechst). N = 3–4 sections of 4 individual fish **: p-value<0.01.
Figure Data
Acknowledgments
This image is the copyrighted work of the attributed author or publisher, and
ZFIN has permission only to display this image to its users.
Additional permissions should be obtained from the applicable author or publisher of the image.
Full text @ PLoS Genet.