
|
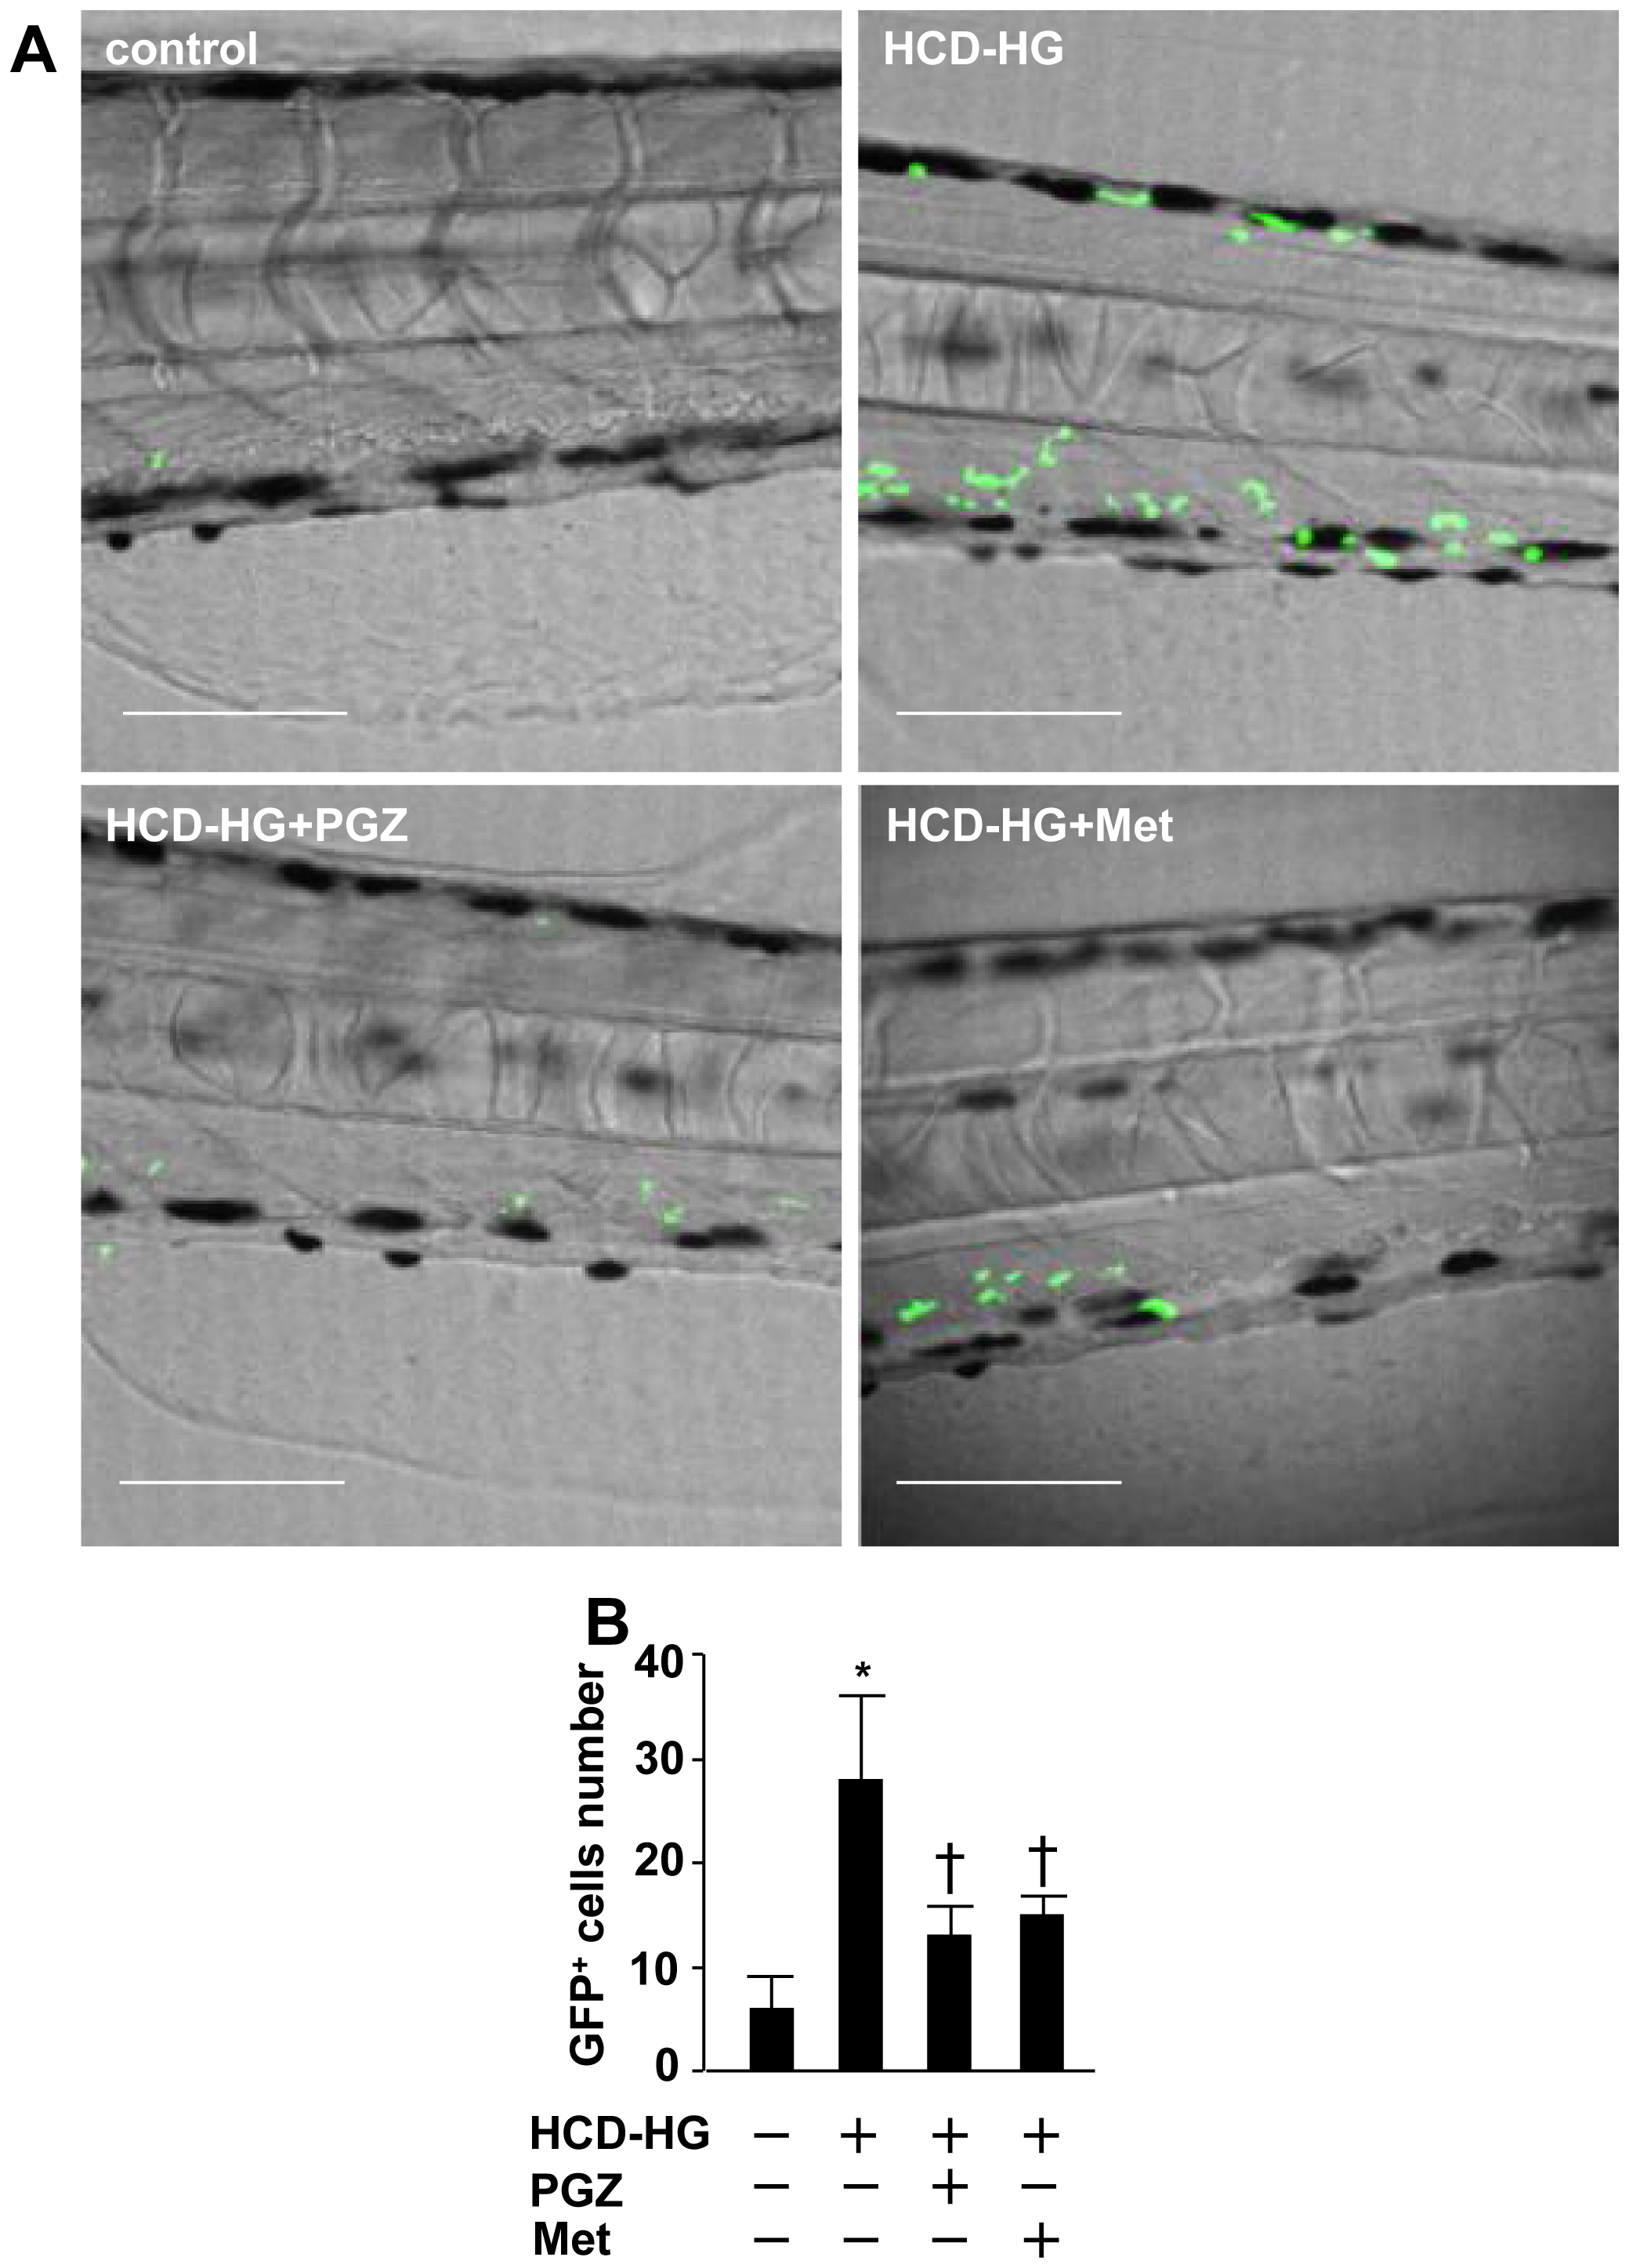
Fig. 4
HCD-HG treatment induced inflammatory cells infiltration.
A: HCD-HG treatment resulted in the increased number of GFP+ cells around the caudal vein. B: GFP+ cells that locate within 50 μm from the lumen of the caudal artery were counted. n>5 in each group and the experiment was repeated for three times. The results were compared between normal and HCD-HG treated group, HCD-HG treated group and HCD-HG+ pioglitazone or metformin group respectively compared between the four groups by Student t test, p<0.05. Scale bar = 80 μm. Asterisk (*): Comparison of the number of GFP+ cells between control group and HCD-HG group. Cross(†): Comparison of the number of GFP+ cells between HCD-HG group and drug treatment groups, respectively.