
Fig. 6
- ID
- ZDB-IMAGE-140730-92
- Publication
- Kapp et al., 2013 - The integrator complex subunit 6 (ints6) confines the dorsal organizer in vertebrate embryogenesis
- All Figures
- Figures for Kapp et al., 2013
|
Fig. 6
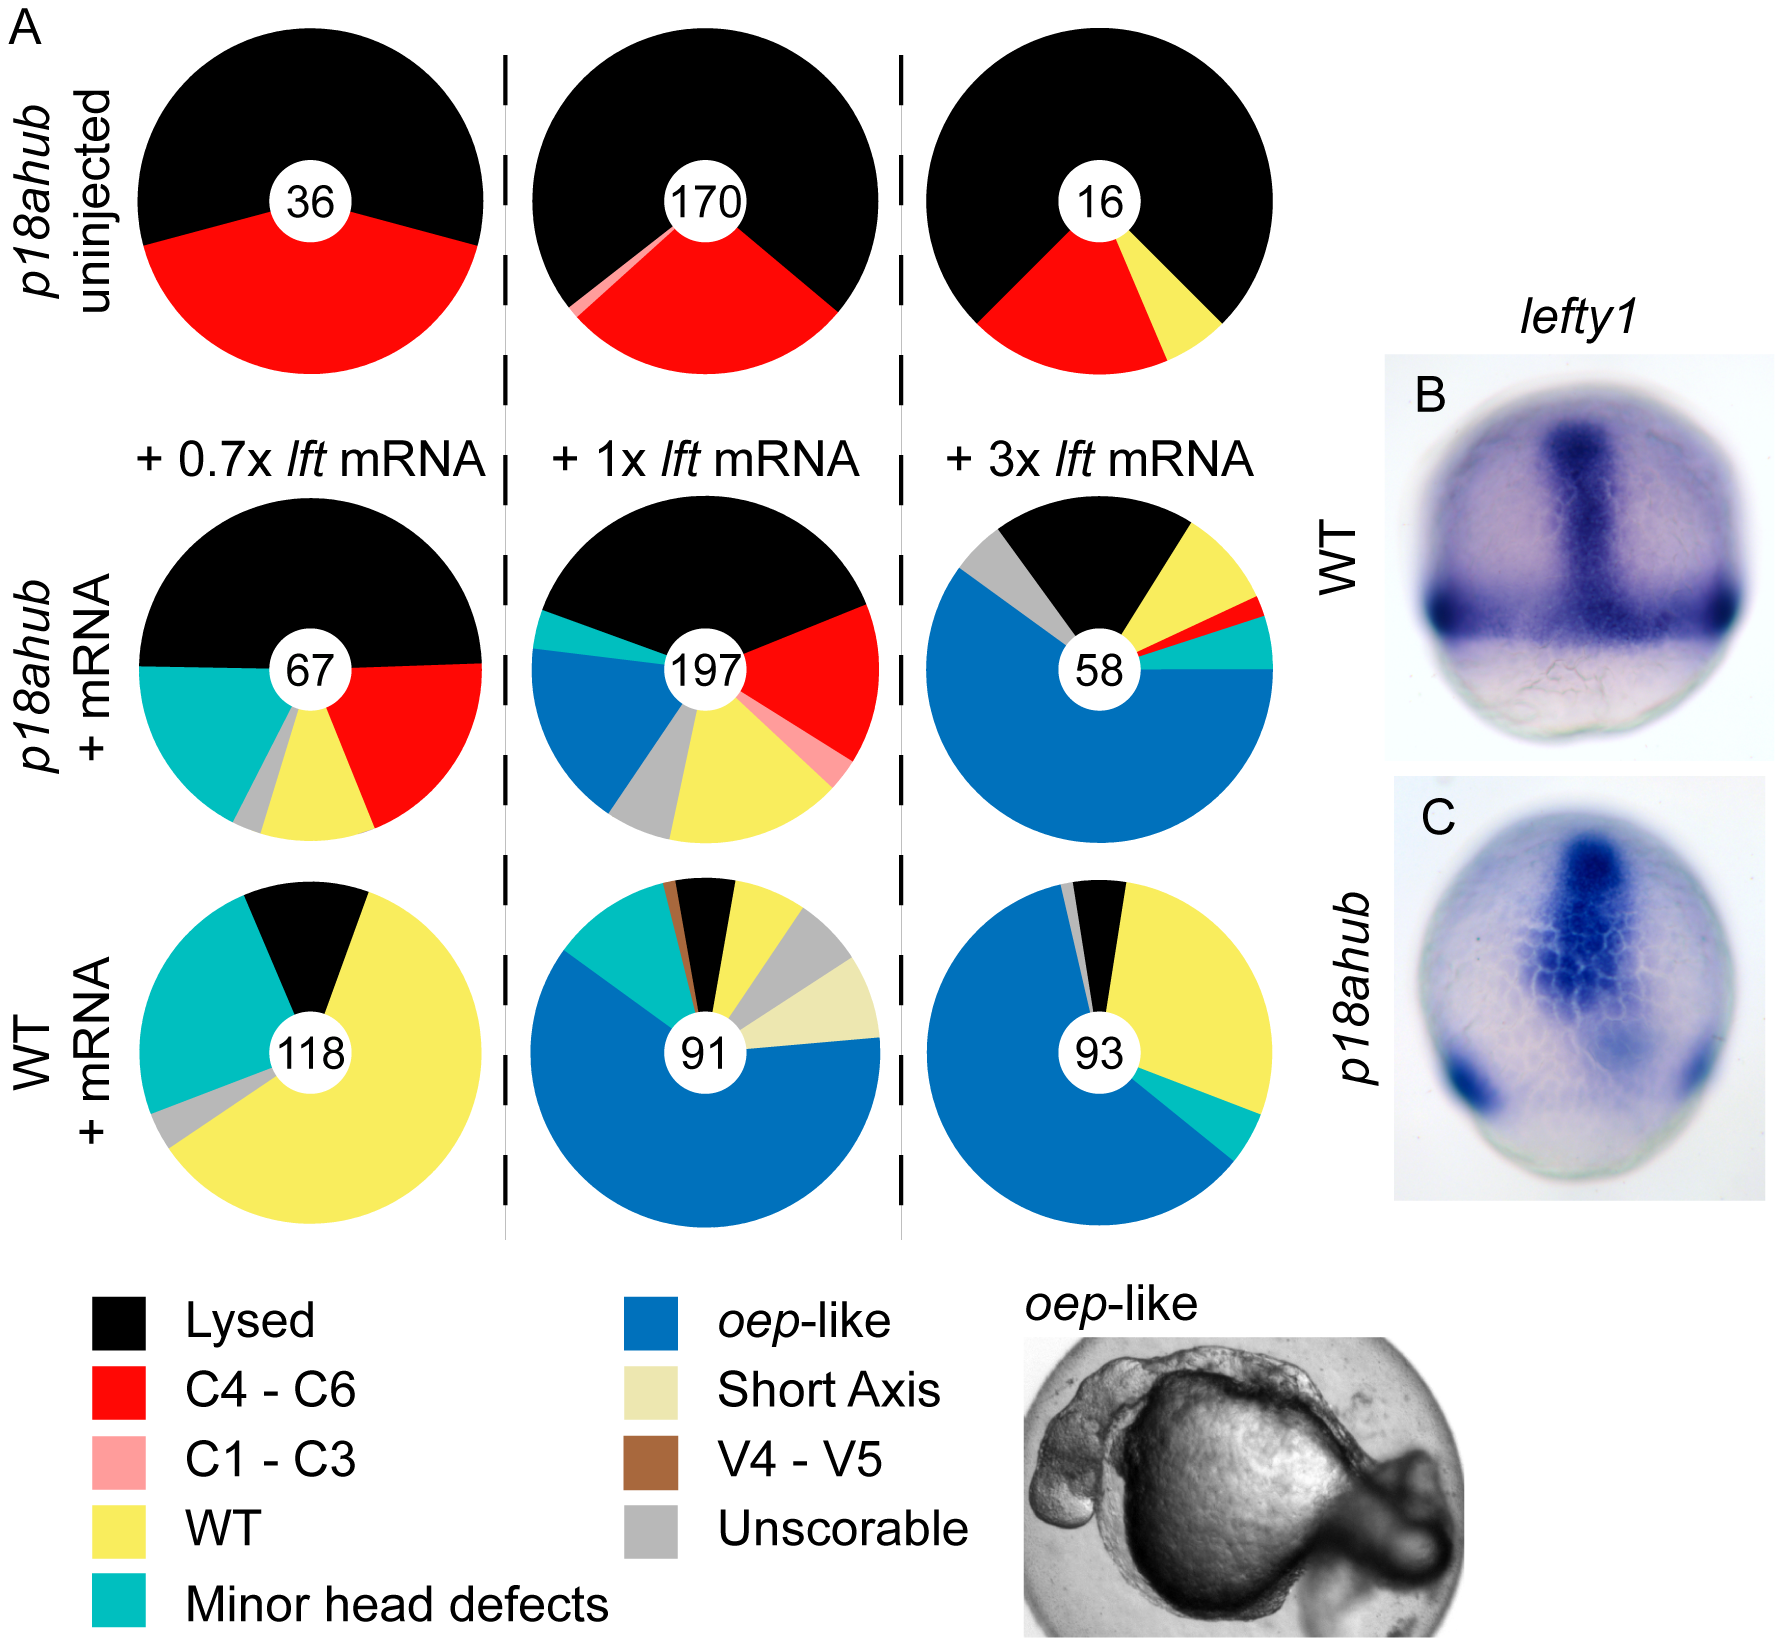
Lefty misexpression suppresses patterning defects of p18ahub embryos.
(A) Pie charts indicate fractions of embryos at 24 hpf with the indicated phenotypes. Number of embryos is at the center of each chart. Labels across indicate the amount of lefty1 (lft1) mRNA injected. Top row shows uninjected p18ahub control clutch for each experiment, middle row indicates p18ahub embryos injected with mRNA, and bottom row is WT embryos injected with mRNA. +1× lft mRNA corresponds to 1 pg mRNA. (B and C) In situ hybridization for lft1 in a mid gastrula stage WT (B, n = 12) and p18ahub (C, n = 13) embryos; lateral views, dorsal facing.