
Image
|
Figure Caption
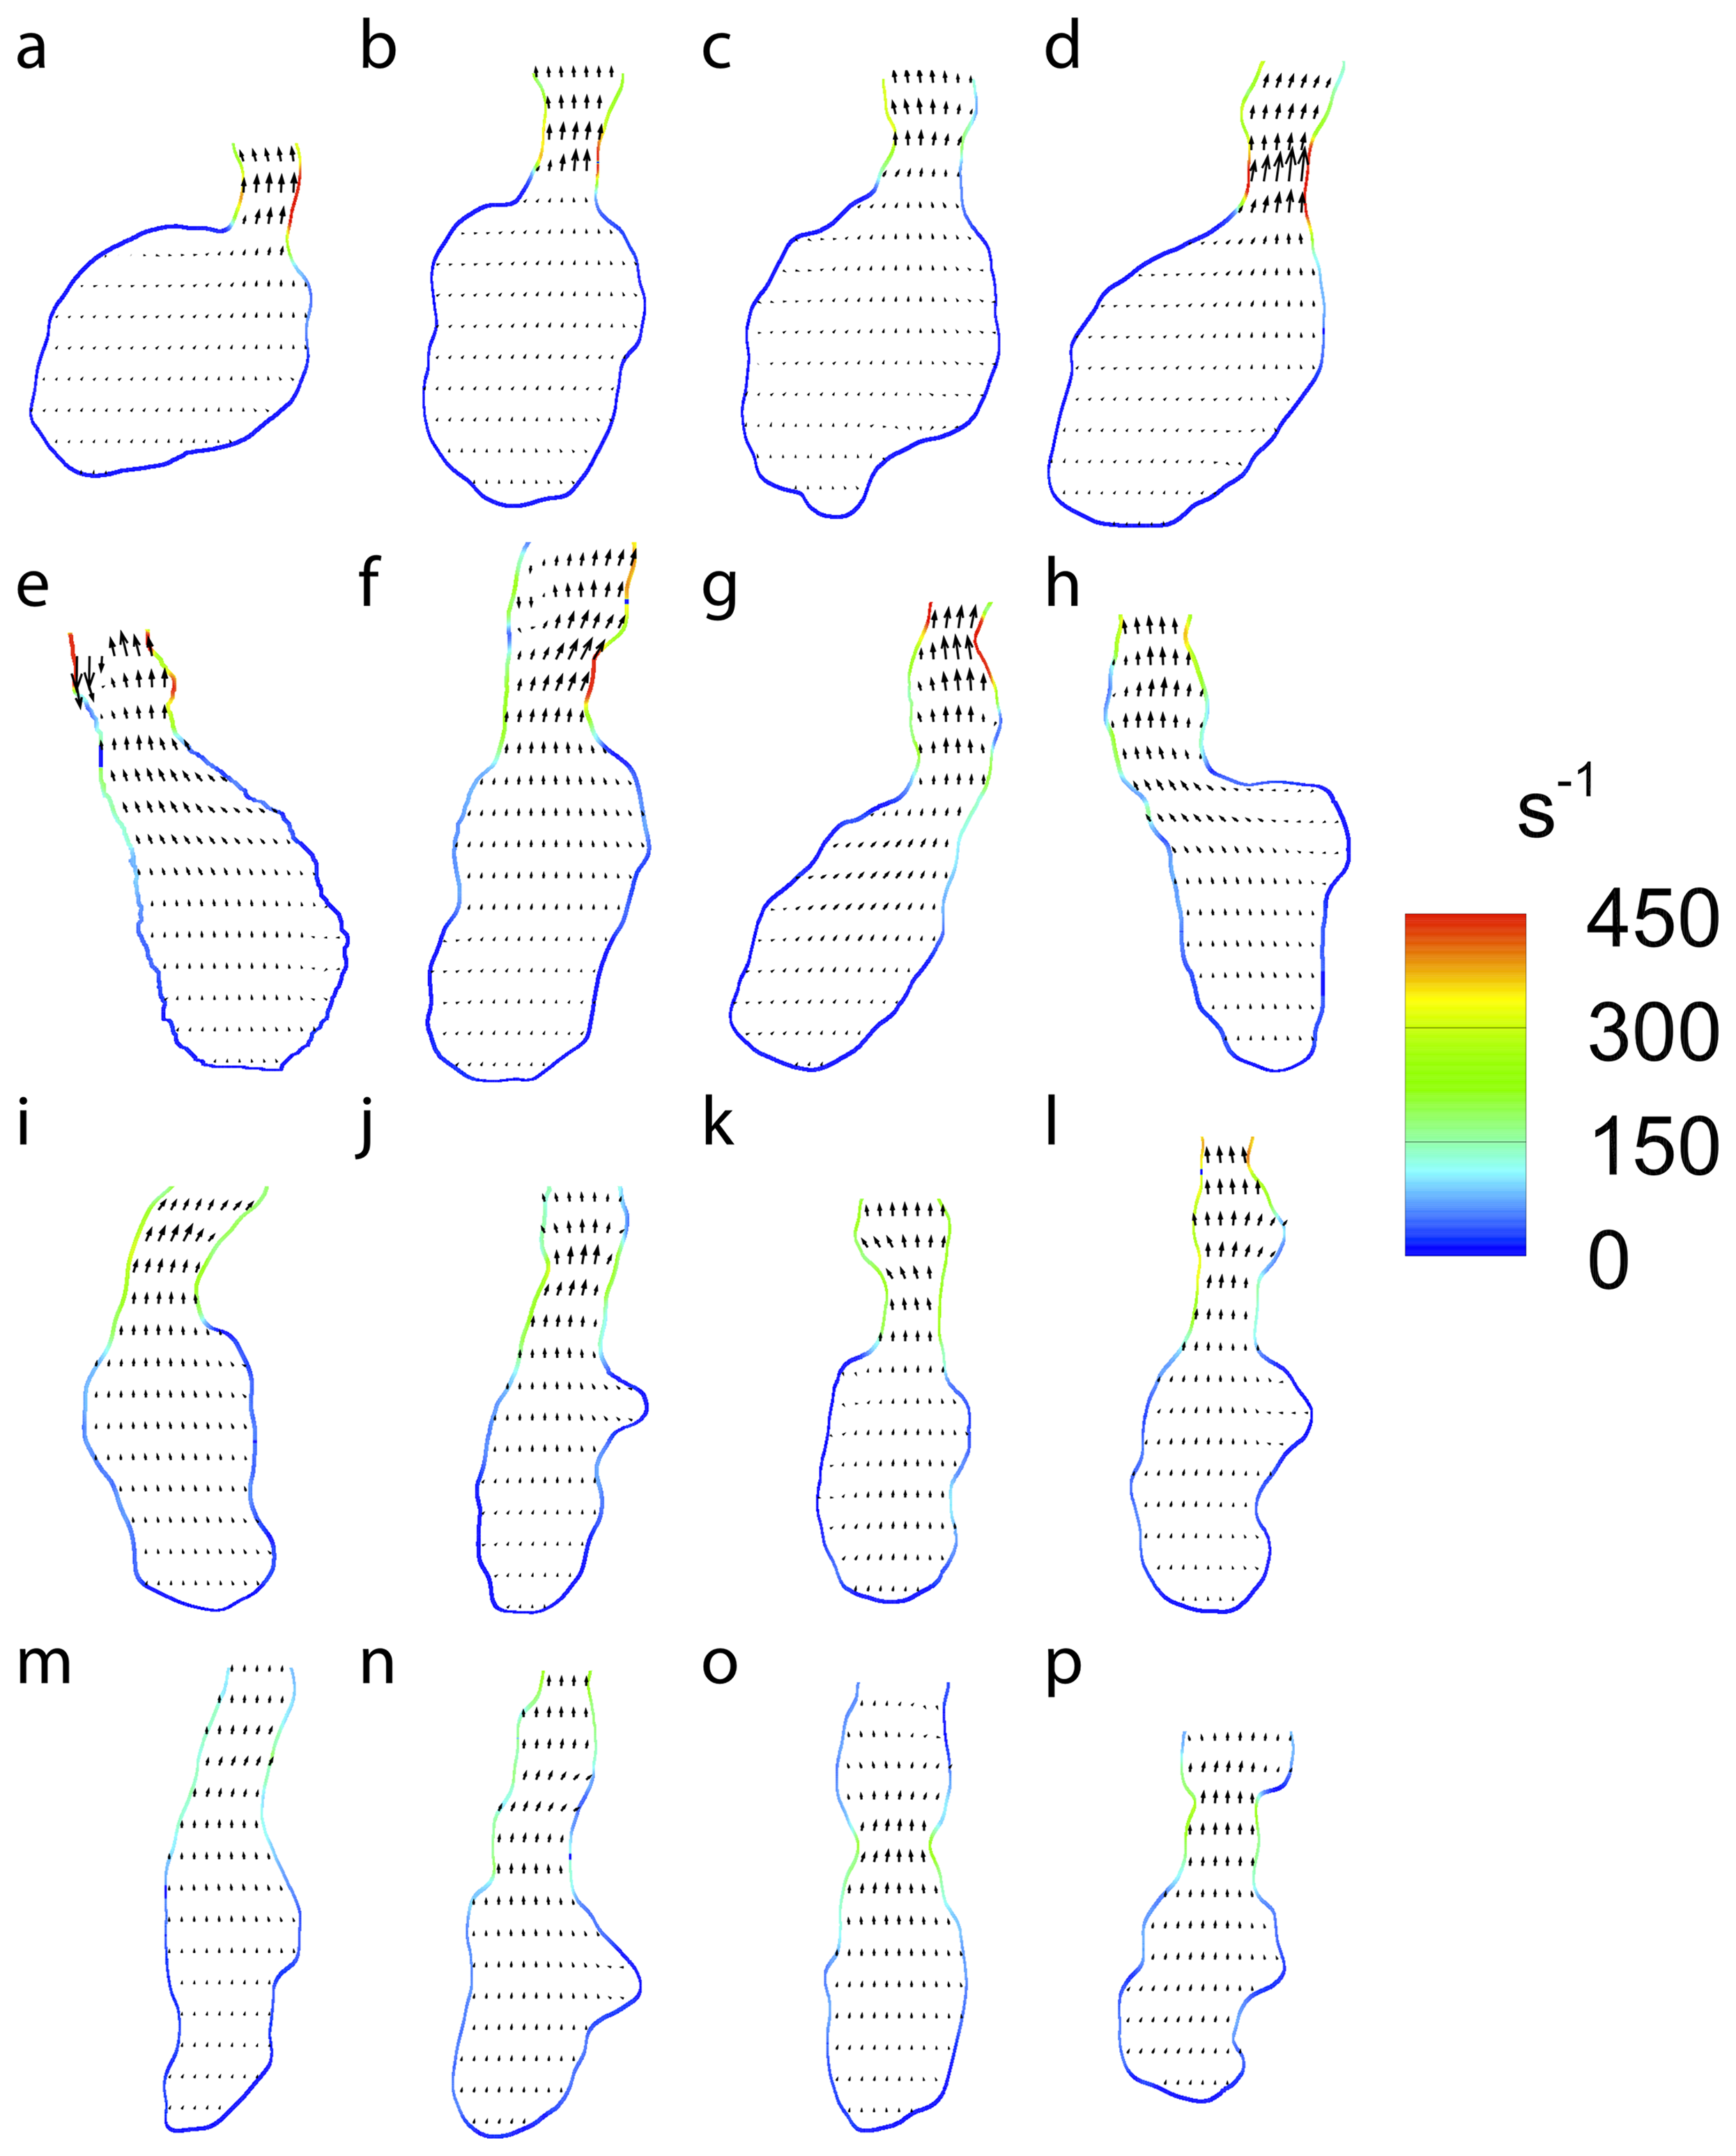
Fig. 6
Wall shear rate during peak systole for (a)–(d) 3dpf, (e)–(h) 4dpf, (i)–(l) 5dpf and (m)–(p) 6dpf embryonic zebrafish used in this study.
Vectors indicate the magnitude and direction of velocity while colourmap provides the wall shear rate. For clarity only every second vector is shown in the horizontal direction and every fifth in the vertical direction.
Acknowledgments
This image is the copyrighted work of the attributed author or publisher, and
ZFIN has permission only to display this image to its users.
Additional permissions should be obtained from the applicable author or publisher of the image.
Full text @ PLoS One