
Image
|
Figure Caption
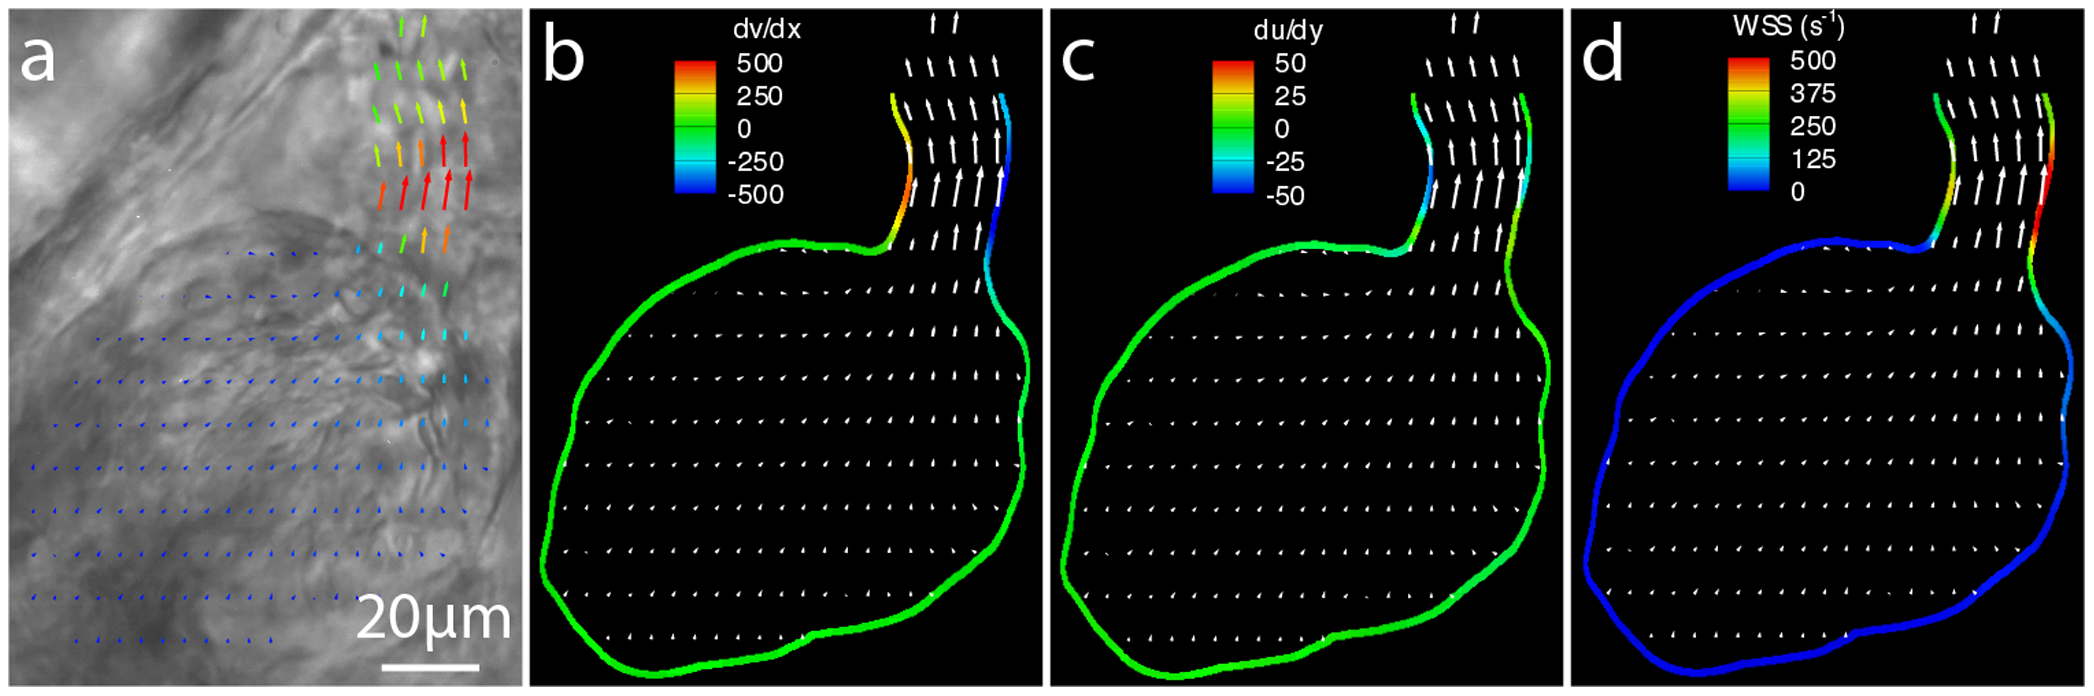
Fig. 3
Calculation of the wall shear rate (s 1) from the velocity and the slope of the wall.
(a) Brightfield images of a 3dpf zebrafish ventricle during systole with overlaid with velocity vectors calculated using PIV. Contours of (b) dv/dx, (c) du/dy and (d) the calculated wall shear rate (s1) also overlaid with velocity vectors. Shear is concentrated in the region of the ventricular bulbar valve with the majority of the remainder of the heart experiencing comparatively low shear.
Acknowledgments
This image is the copyrighted work of the attributed author or publisher, and
ZFIN has permission only to display this image to its users.
Additional permissions should be obtained from the applicable author or publisher of the image.
Full text @ PLoS One