
|
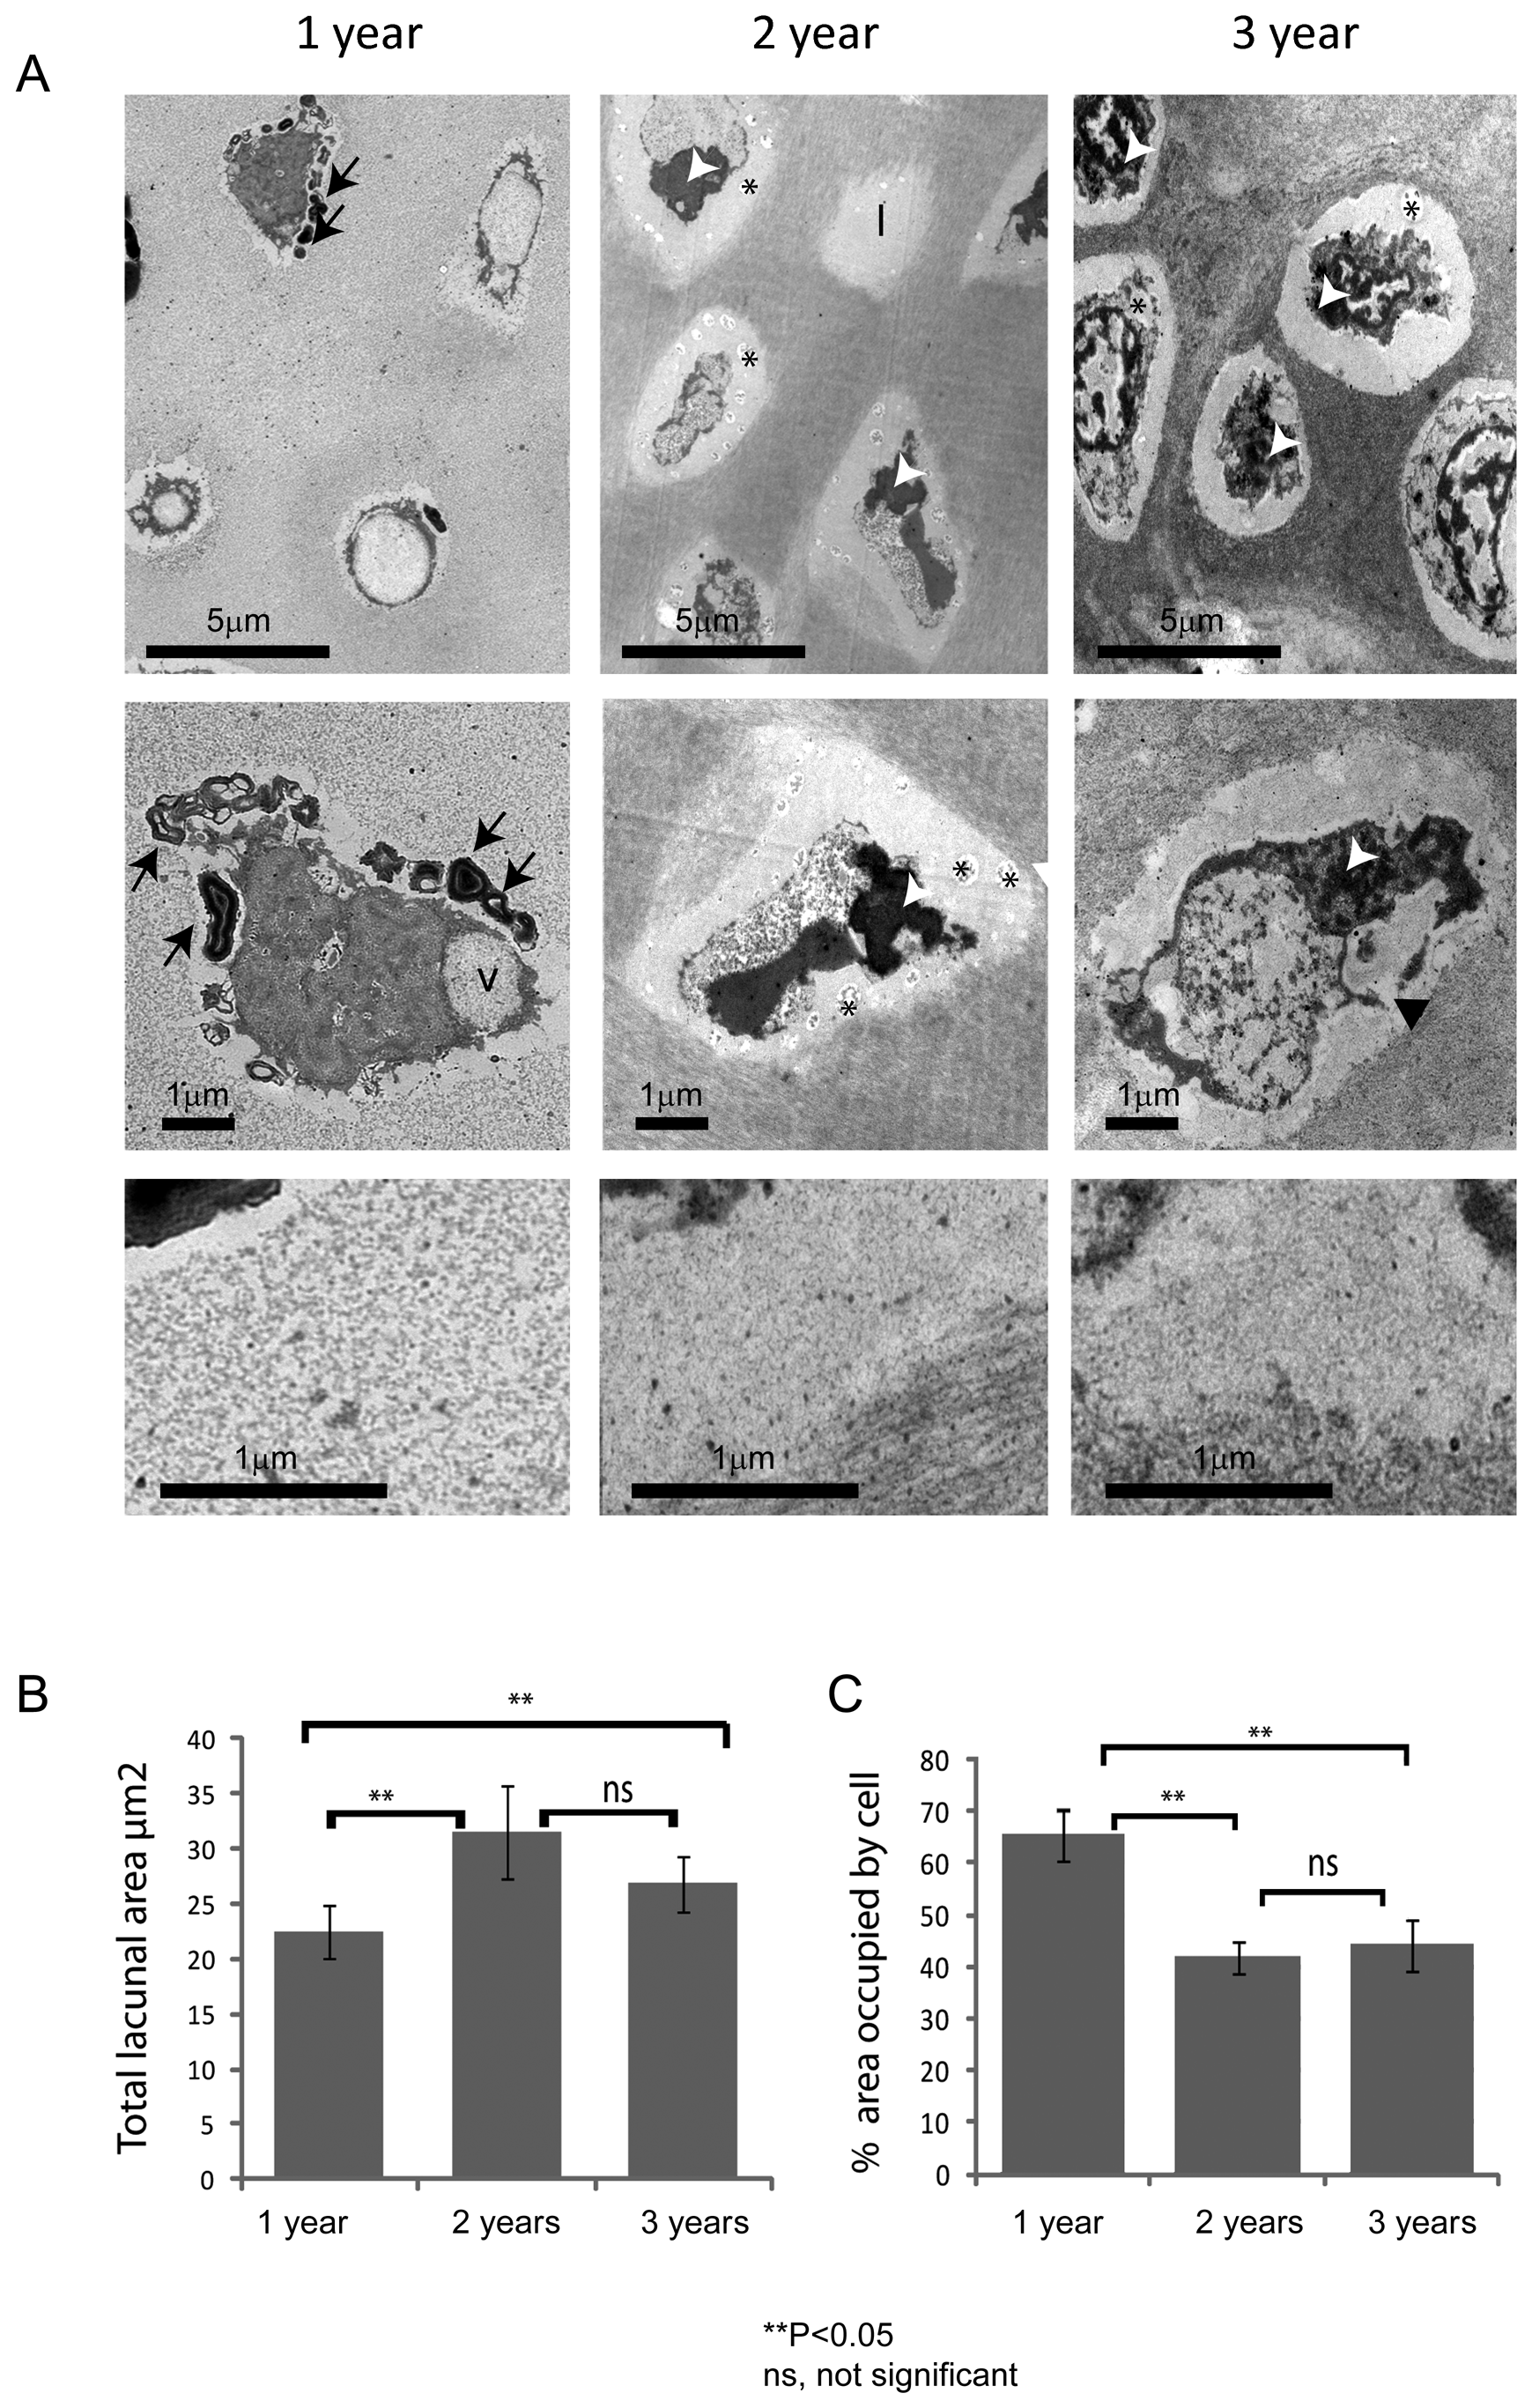
Fig. 3
The vertebral cartilage of aged fish display changes in matrix ultrastructure and cell morphology.
A. Representative images showing the ultrastructure of vertebral cartilage, chondrocytes and pericellular matrix (top panel, middle panel and bottom panel, respectively) at 1, 2 and 3-years (left, middle and right panels, respectively). Chondrocytes display morphologies suggestive of programmed cell death at all stages. Note prominent lacunae in 2 and 3 year samples and increase in electron density of surrounding ECM. B. Graph showing mean lacunal area at each age. Note significant increase in 2 and 3-year samples, relative to 1 year samples tested by One-way ANOVA; 1 vs 2 year P=3.26E-07, 1 vs 3 year P=0.00945, 2 vs 3 year P=0.0512. C. Graph showing percentage area occupied by cell at each age. Note significant decrease in 2 and 3 year samples, relative to 1 year samples tested by One-way ANOVA; 1 vs 2 year P=1.13E-15, 1 vs 3 year P=1.61E-10, 2 vs 3 year P=0.357. l, lacunae; v.; intracellular vacuoles; black asterisks, vesicular debris; black arrows denote myelin figures; white arrows show condensed nuclear material; black arrowhead shows discontinuity of cell membrane. Scalebar in microns.