
|
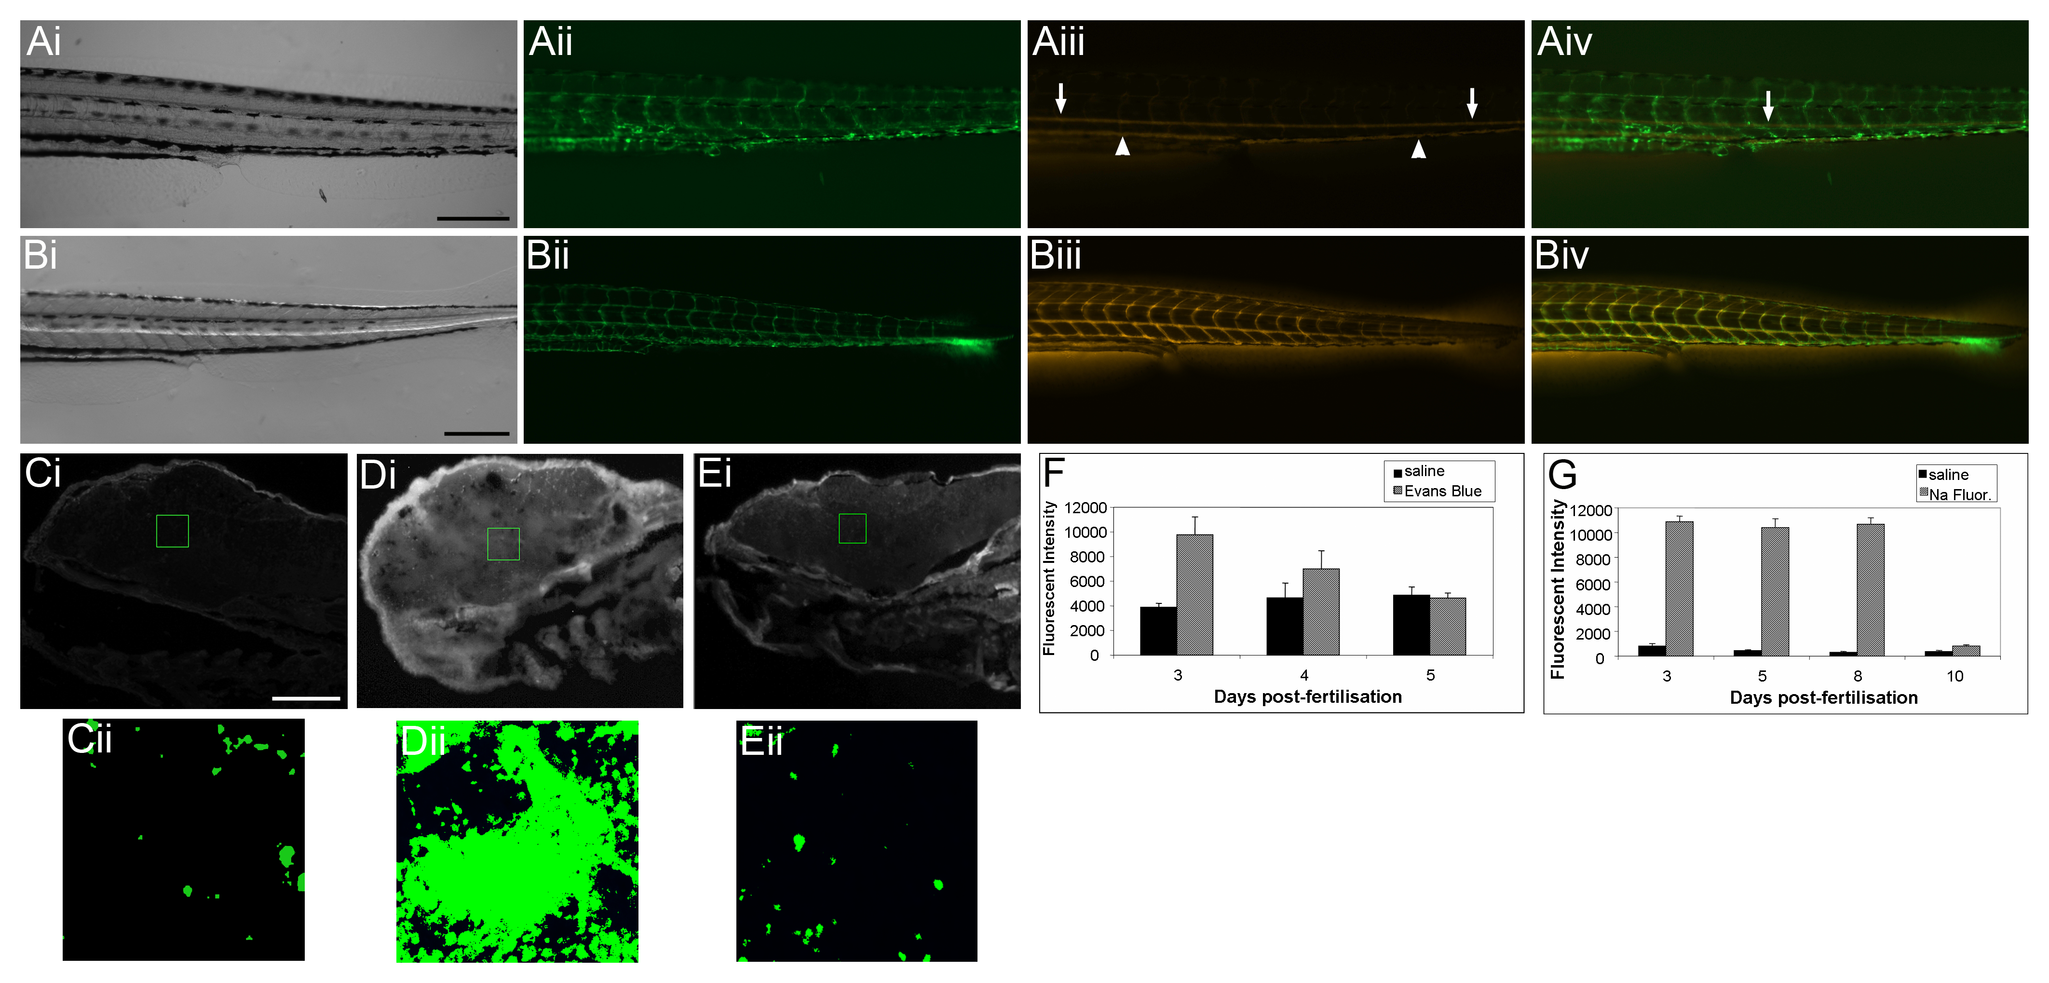
Fig. 1
Investigation of blood-brain barrier maturation using fluorescent dyes.
Ai-iv) One hour after pericardial injection of Evans blue into 8 d.p.f. Tg(fli1a:EGFP)y1 larvae, strong Evan’s blue fluorescence could be observed in the dorsal aorta (arrows) and vena cava (arrowheads) and weak fluorescence could be observed in individual segmental vessels of the trunk. Bi-iv) 4 hours after injection of Evan’s blue, strong fluorescence is still observed in dorsal aorta and vena cava and additionally in segmental vessels. In addition, fluorescence is also observed in trunk muscles between the segmental vessels and in the fin mesenchyme demonstrating that the dye has penetrated into surrounding tissue. Ci) Parasagittal section of a 3 d.p.f. zebrafish larva 3 hours after pericardial injection with saline control. Cii) High magnification fluorescent imaging of the region of marked in Ci). Di) Parasagittal section of a 3 d.p.f. zebrafish larva 3 hours after pericardial injection with Evan’s blue. Dii) High magnification fluorescent imaging of the region of marked in Di). Ei) Parasagittal section of a 5 d.p.f. zebrafish larva 3 hours after pericardial injection with Evan’s Blue. Cii) High magnification fluorescent imaging of the region of marked in Ci). Cii – Eii) The fluorescent intensity of dye within the brain was quantified using image thesholding (pseudo-coloured green) and area over threshold was measured using AnalySis software. F & G) The fluorescence intensity of injected dyes was measured in the brain of zebrafish following peripheral injection at various time points of zebrafish development. Graphs show mean fluorescent intensity (± std dev.) for each treatment. F) Evans blue, (961 Da) a large molecule known to form multimers with serum proteins, is excluded from the brain from day 5. G) Sodium fluorescein (376 Da) permeates into the brain until 8 d.p.f. but is excluded at 10 d.p.f. Scale bar represents 250 μm in A and B and 50 μm in C - E.