
|
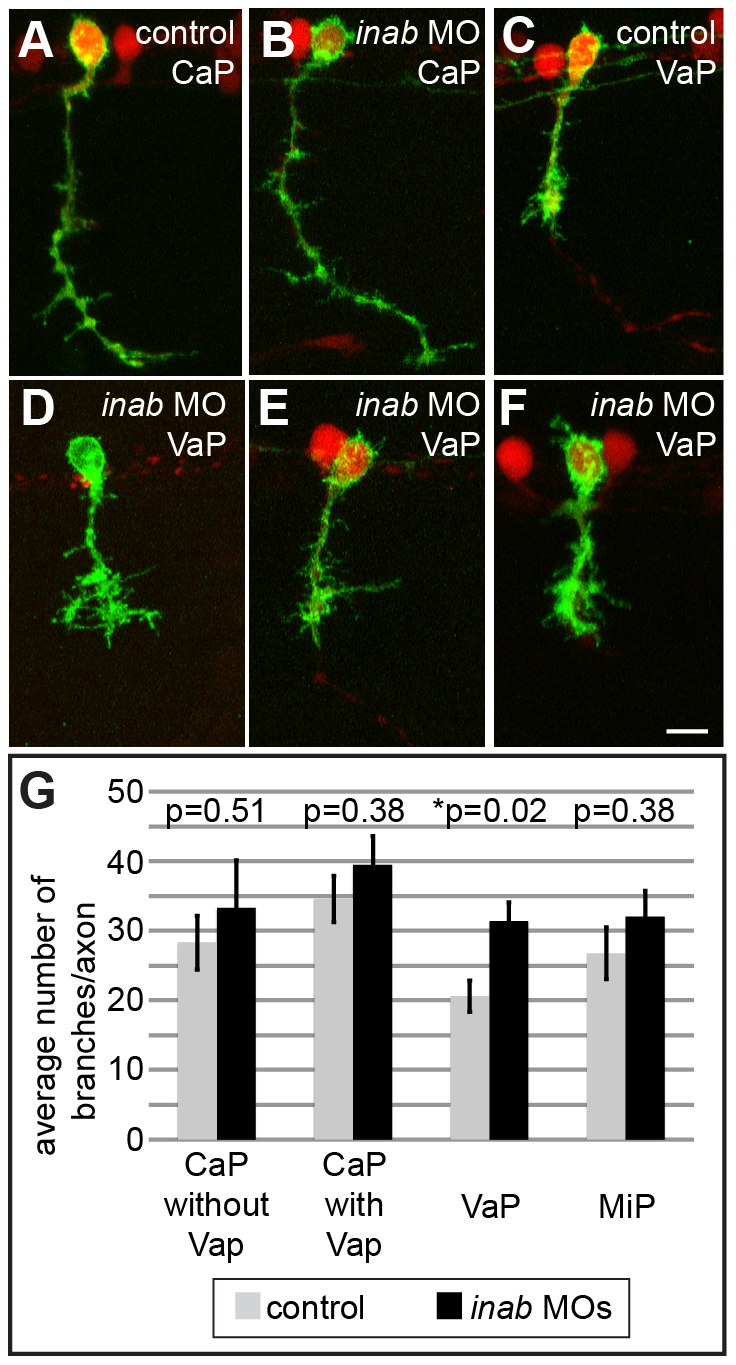
Fig. 5
inab is required for morphology of VaP axons.
(A–F) Z-projections of confocal images of control and inab MO-injected embryos. At 26 hpf, UAS:EGFP plasmid injection into mnx1:GAL4;UAS:tdTomato transgenic embryos reveals similar overall morphology of CaP neurons in both control (A) and MO-injected embryos (B). VaP axons in MO-injected embryos (D–F) have more processes than VaP axons in control embryos (C). (G) Graph representing average number of branch points per axon in individually-labeled cells in control and MO-injected embryos. No significant difference between conditions for CaP neurons alone (n = 11, p = 0.51), CaP MNs that are located next to VaP MNs (n = 11, p = 0.38), or MiP MNs (n = 10, p = 0.38). Only the increase in VaP axon processes is significant (n = 14, p = 0.02). Scale bar is 10 μm in A–F.