
|
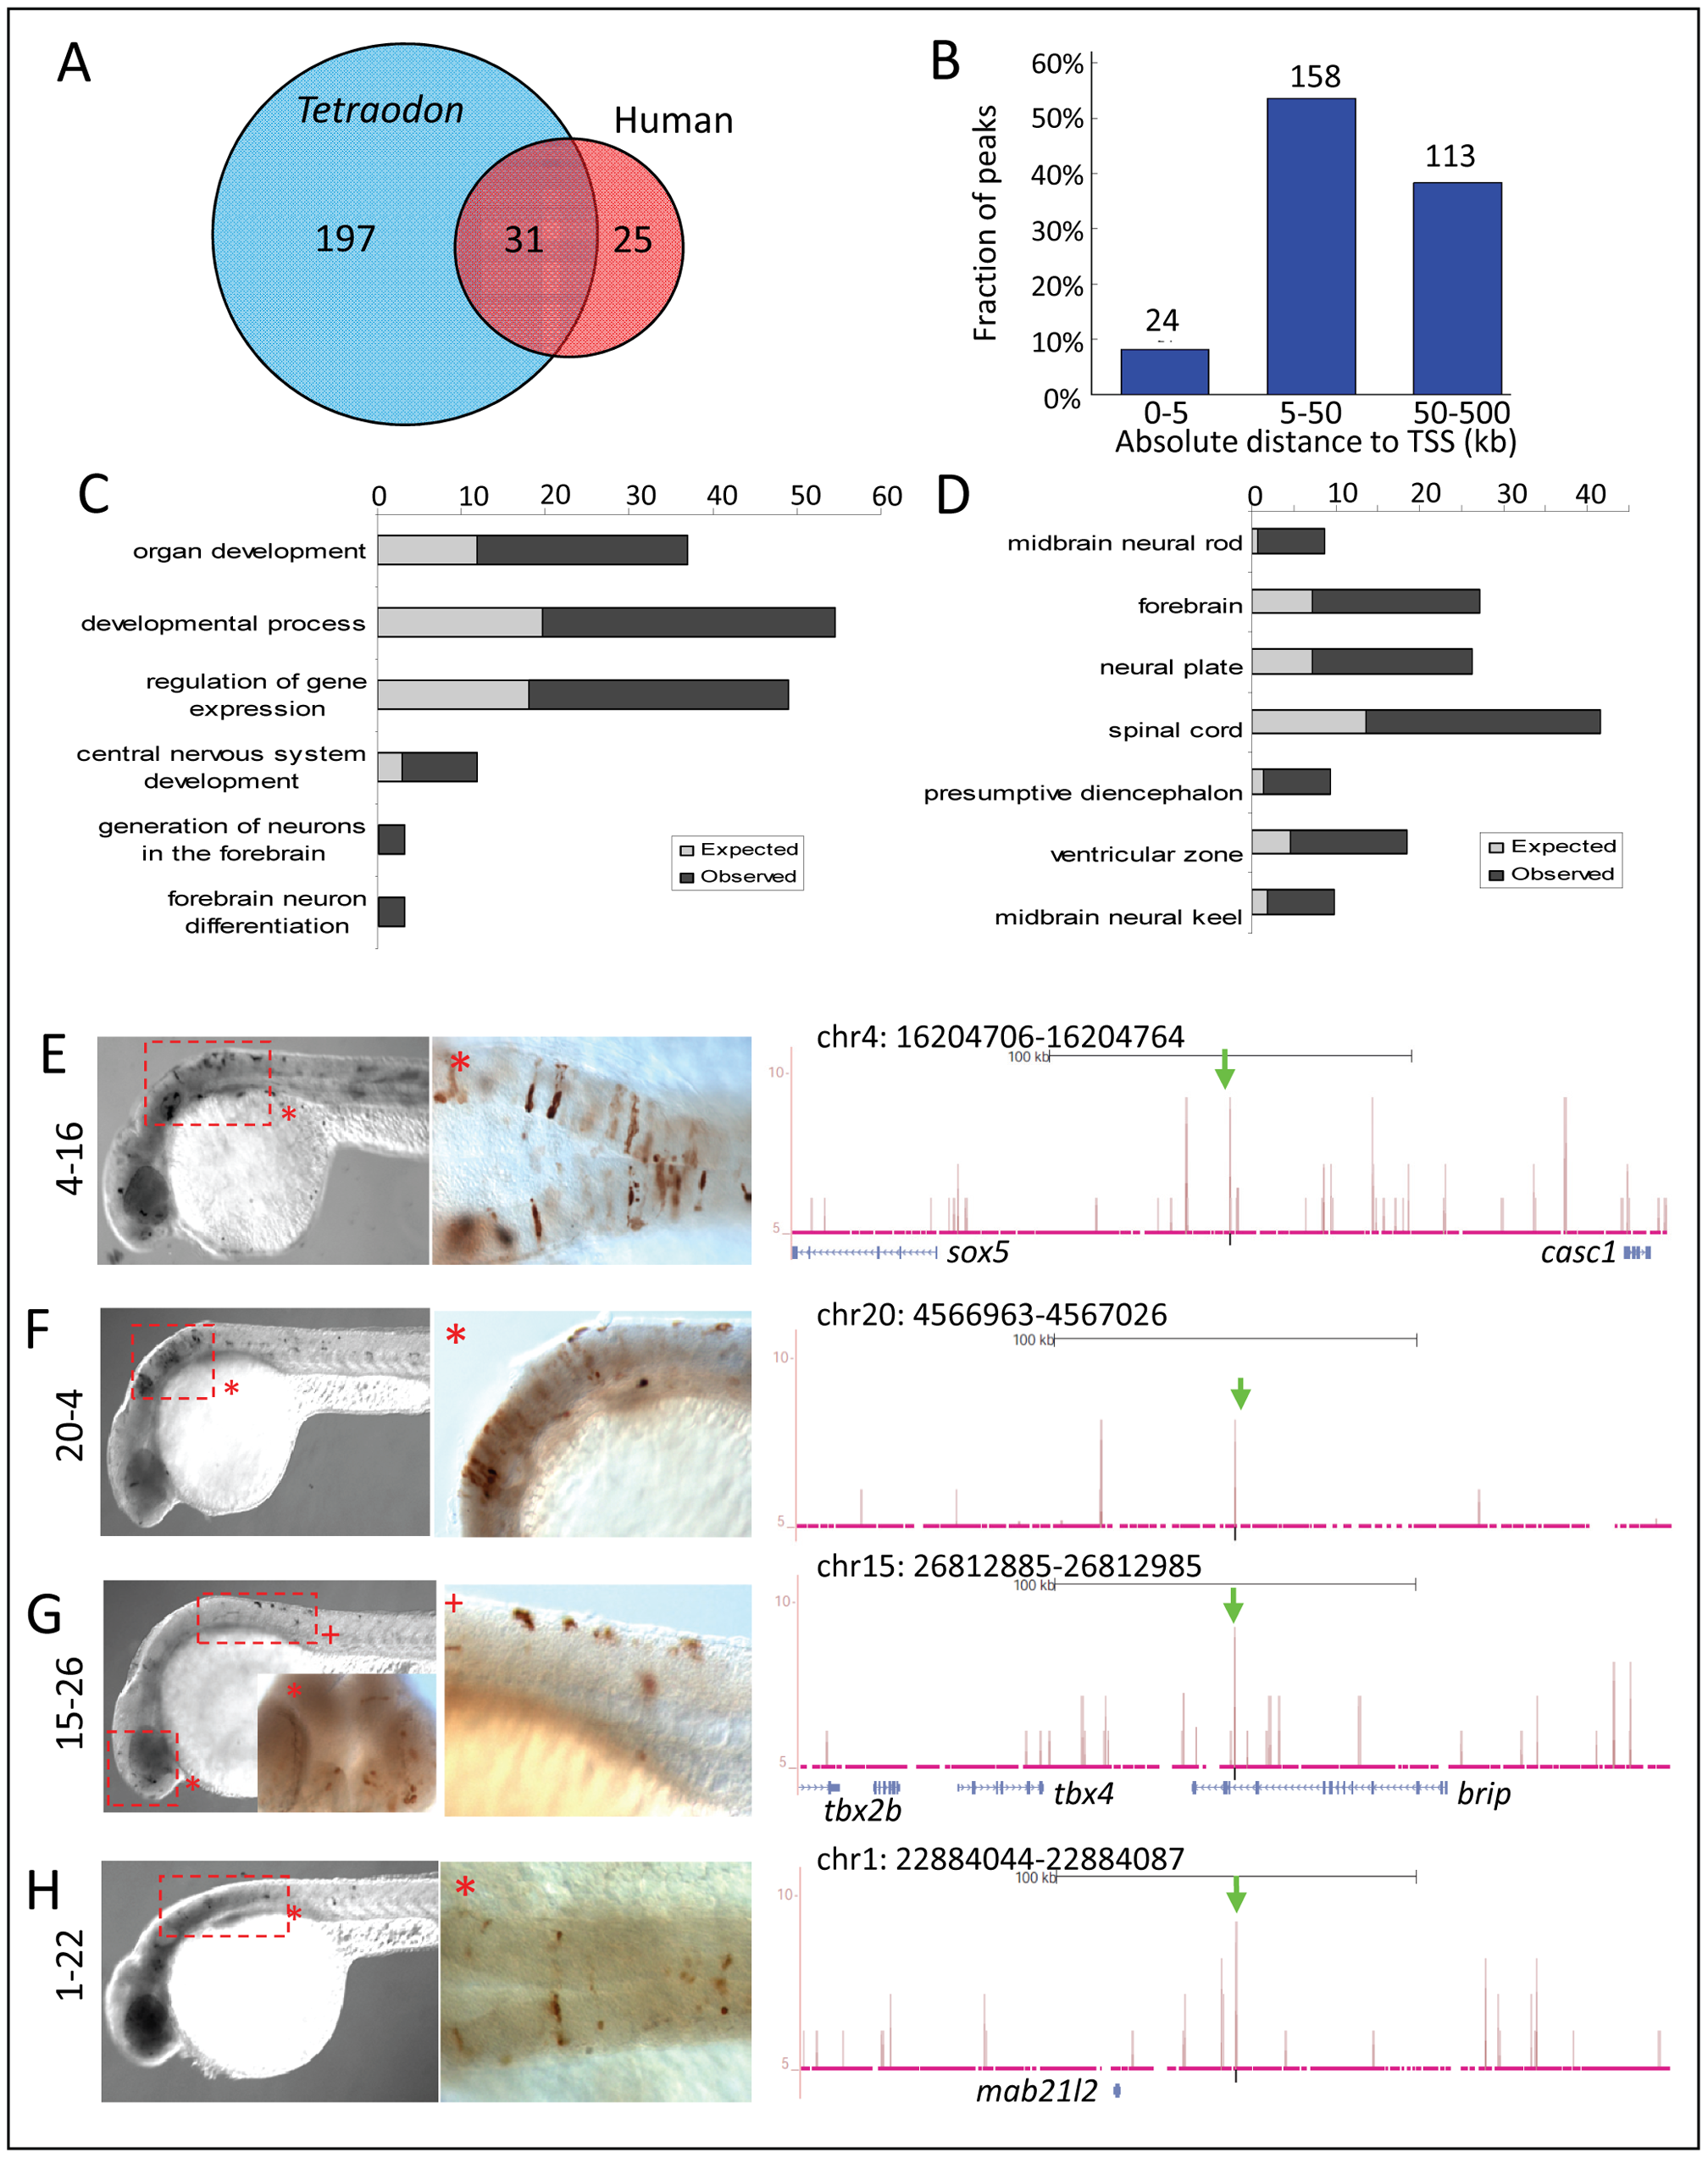
Fig. 8
Zic3 regulates neural-specific expression through CNEs.
A, number of CNEs found among the Zic3 peaks. A large subset was conserved between zebrafish and Tetraodon, while a smaller subset was conserved between zebrafish and human. B, distribution of CNE peaks with regards to their distance from TSS of genes. Enrichment of biological process (C) and tissue-specific expression (D) terms among genes associated with CNE peaks. Light and dark grey bars represent expected and observed enrichments of functional categories according to DAVID GO terms. E–H, representative figure of 24 hpf F0 embryos expressing gfp (left panel) driven by Zic3 CNE peaks shown in UCSC browser image (right panel, green arrows); black horizontal line at the top of each panel represents 100 kb. E*, H*, dorsal view; F*, G*, lateral view.