
|
Fig. 1
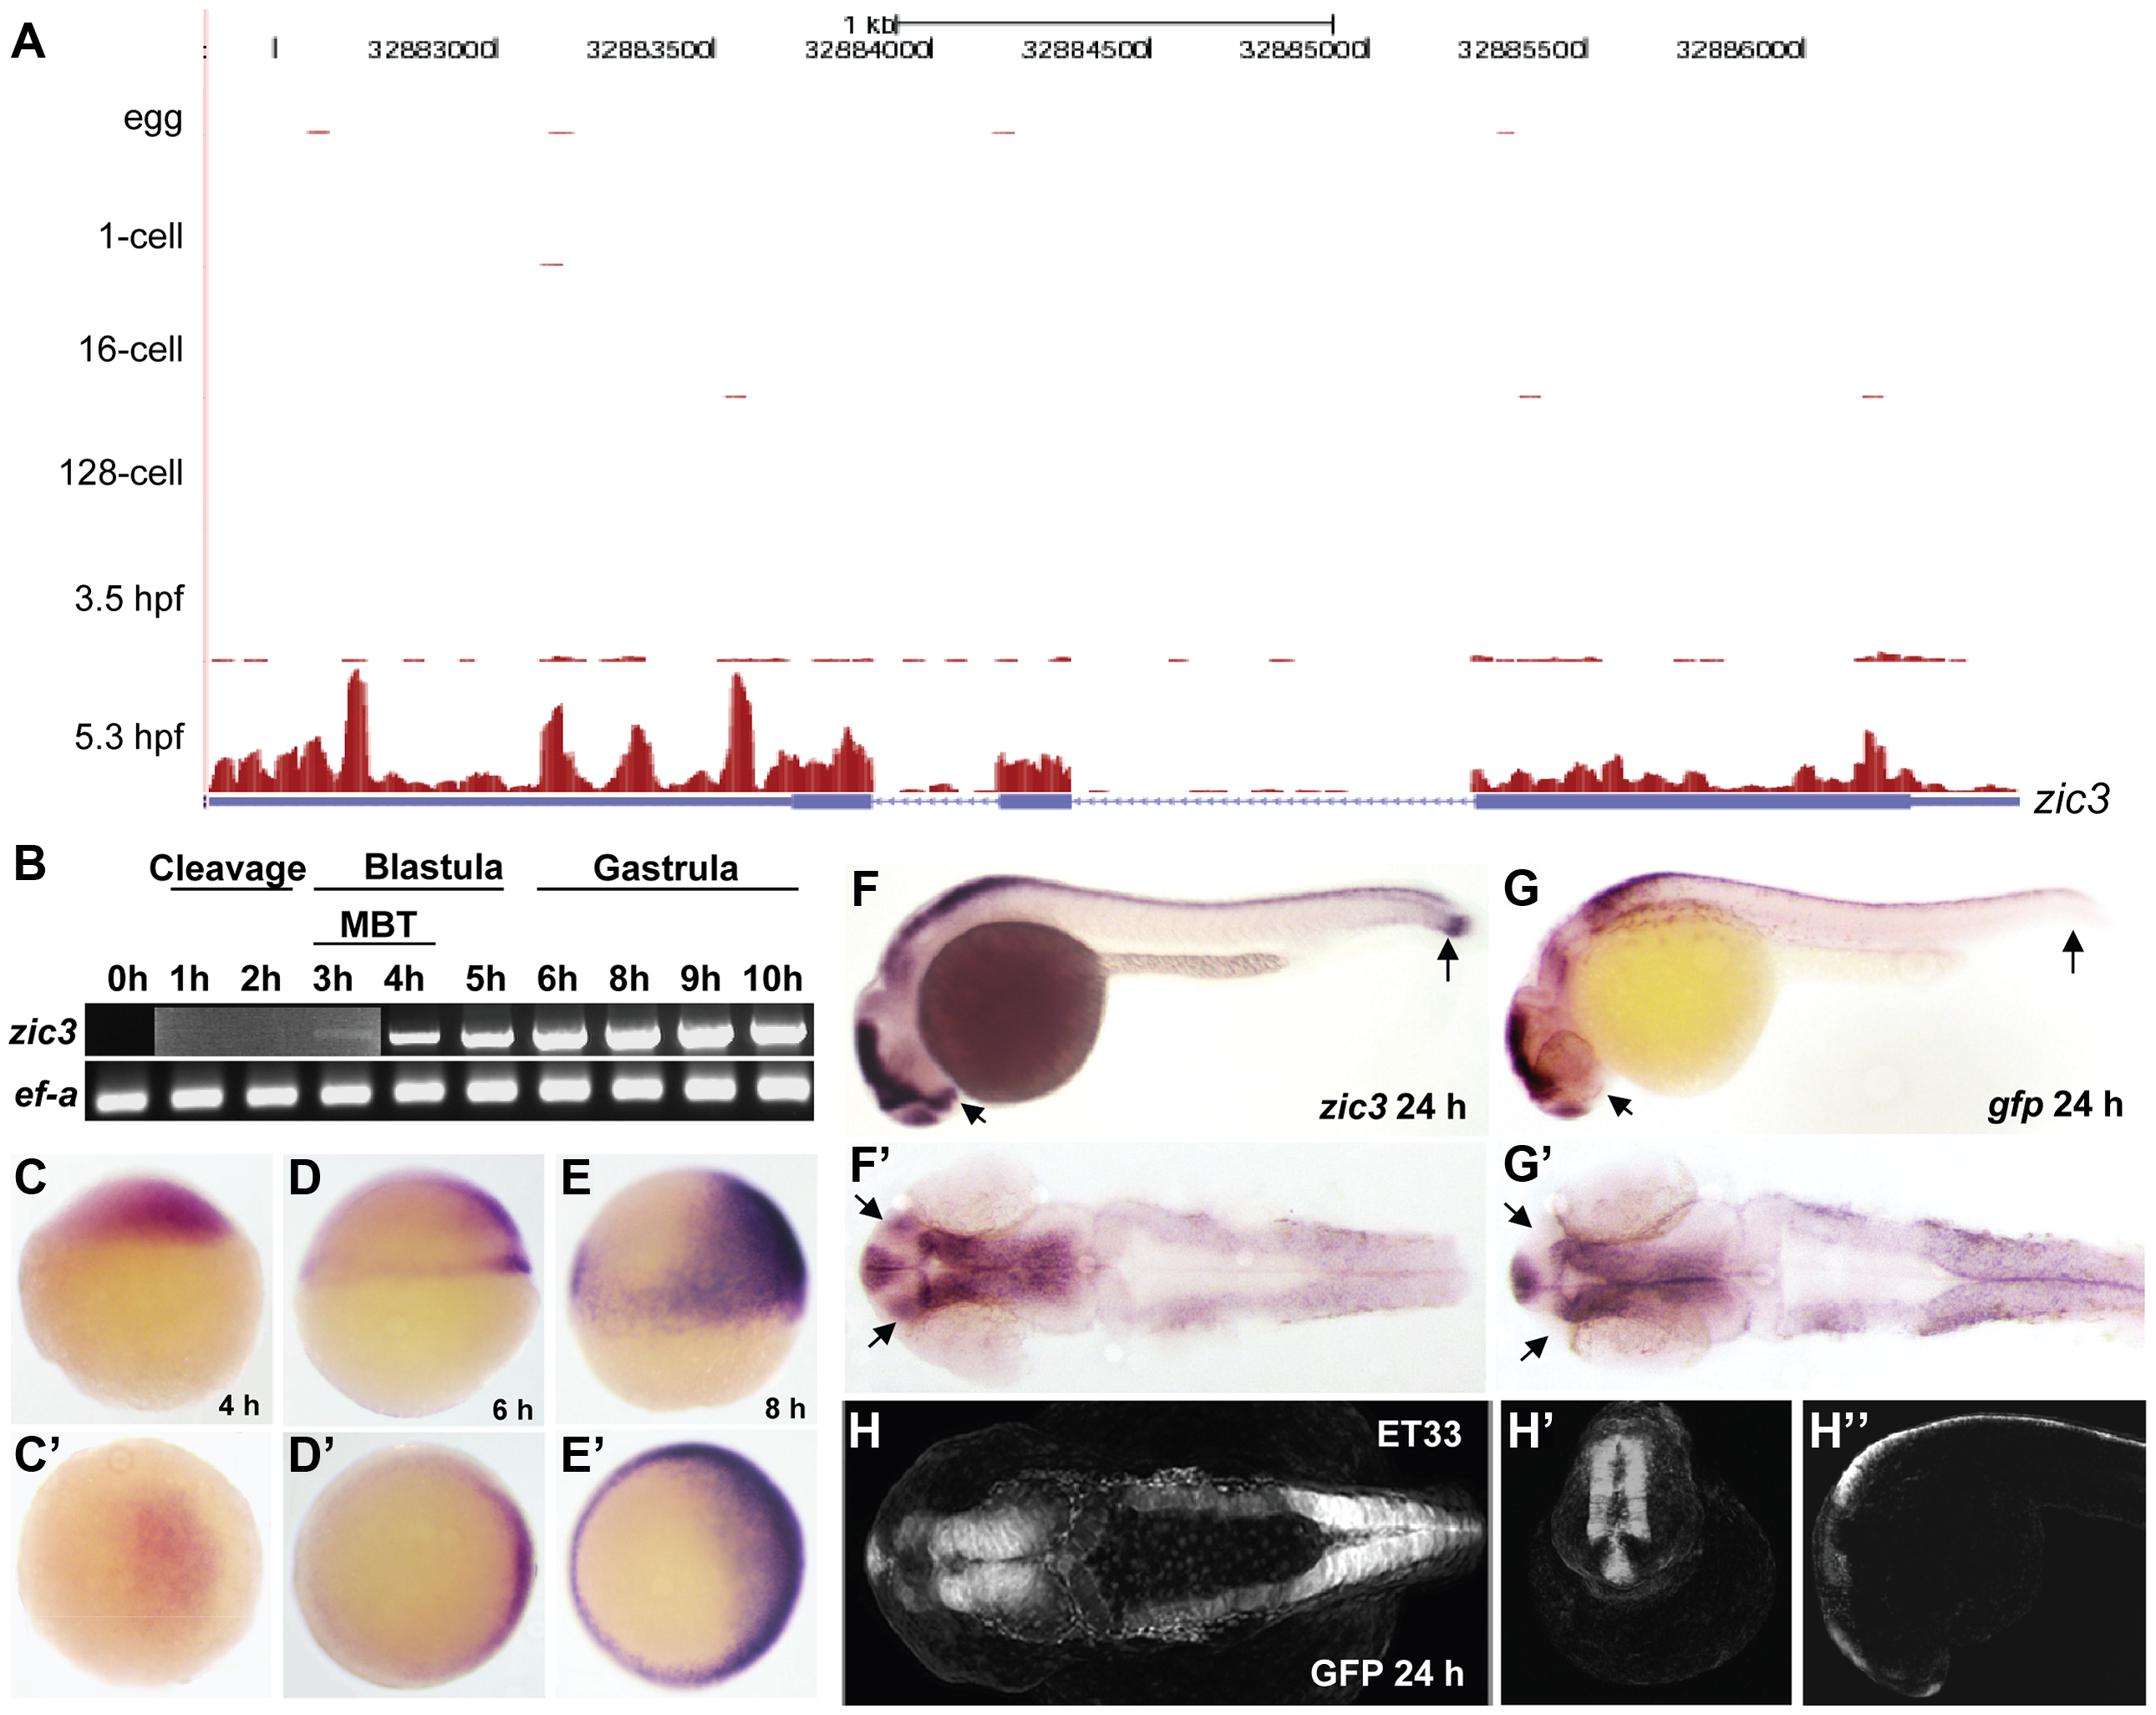
Early expression of zic3 as detected by RNA-seq and RT-PCR.
A, UCSC browser image showing RNA-seq reads (pink vertical histograms) at the zic3 locus (in blue; tall boxes - exons; half-height boxes - UTRs; lines - introns; arrowheads - direction of transcription). B, RT-PCR detection of zic3 transcripts in zebrafish embryo. Portion of image showing expression at 1 hpf to 3 hpf was enhanced to show weak band at 3 hpf. C, D and E, zic3 expression in 4 hpf, 6 hpf, and 8 hpf embryos. Lateral view, dorsal to the right. C2, D2 and E2, animal pole view. F, G, zic3 expression in wild-type and gfp in SqET33 embryos at 24 hpf. F2, G2, dorsal view. Note the absence of gfp expression from the olfactory bulb and presomitic mesoderm domains of the wild-type zic3 expression (arrows). H–H3, GFP expression in live SqET33 embryos at 24 hpf. H, dorsal view, H2, frontal view, H3, lateral view.