
|
Fig. 6
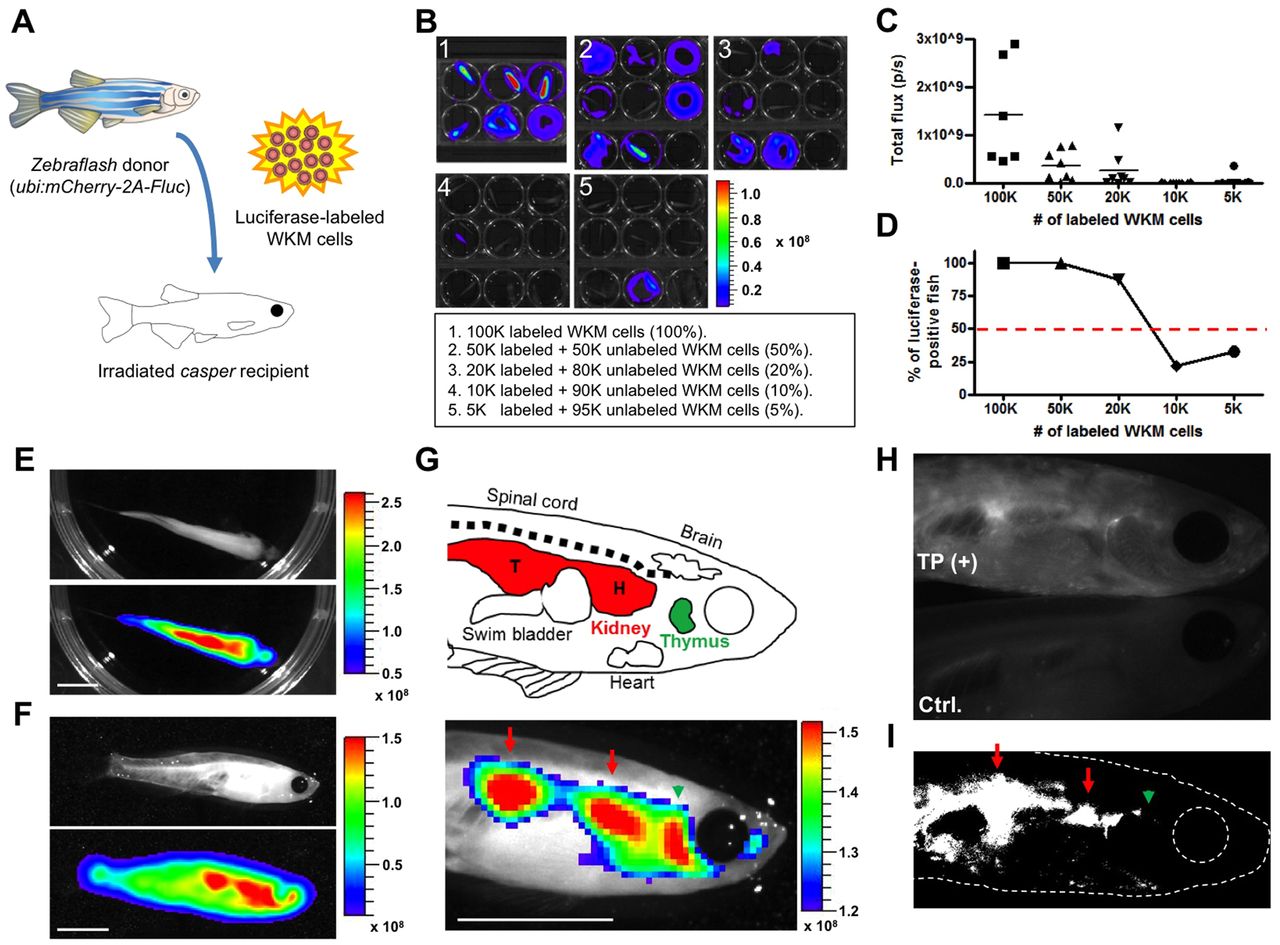
Luciferase-based live imaging after hematopoietic stem cell transplantation. (A) Scheme of marrow transplantation experiments. (B) Representative bioluminescence images of swimming recipient fish transplanted with different ratios of ubi:mCherry-2A-Fluc WKM cells. (C) Bioluminescence reading from recipient fish at 30 days post-transplant (n=6-9 per group). (D) Percentage of recipients with any above-background bioluminescence at 30 days post-transplant. (E,F) Representative bioluminescence images of a freely moving recipient fish, viewed overhead (E) or laterally (F) under anesthesia. (G) (Top) Depiction of the internal anatomy of an adult zebrafish. (Bottom) Representative bioluminescence image of a recipient fish, at high magnification and a higher threshold setting, indicating signals from key hematopoietic stem cell colonization sites. Red arrows indicate the location of trunk kidney (T) and head kidney (H); the green arrowhead points to the thymus. (H,I) Fluorescence images (H) were acquired from the same recipient fish shown in G, along with a non-recipient animal (Ctrl.). Background fluorescence signal was subtracted by ImageJ with a higher threshold setting to reveal signals from key hematopoietic stem cell colonization sites (I). Luminescence signals are reported as radiance (p/sec/cm2/sr) with a color bar. Scale bars: 5 mm.