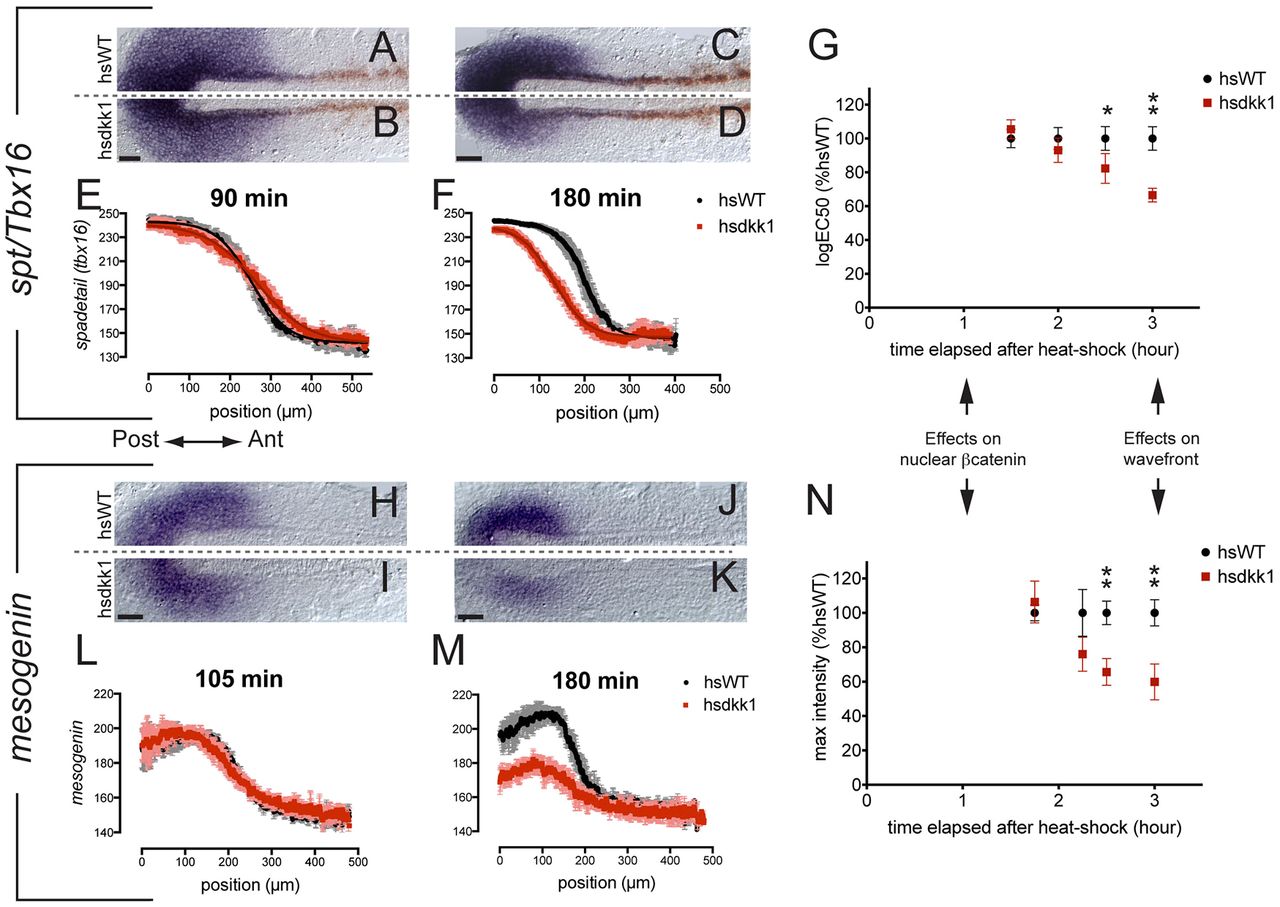
Fig. 6 Wnt target gene expression is reduced four to five somites after heat shock. (A-D,H-K) Dorsal view of flat-mounted PSM from hsdkk1::GFP (B,D,I,K) or WT siblings (A,C,H,J) heat shocked at five (A-D) or six (H-K) somites, fixed 1.5 (A,B), 1.75 (H,I) or 3 (C,D,J,K) hours phs and hybridized with spt (A-D) or msgn1 (H-K) riboprobes. (E,F,L,M) Average intensity profile for spt (E,F) and msgn1 (L,M) along the A/P axis. (G) Normalized logEC50 calculated from fitting plots of spt intensity profile at successive time points. (N) Maximum intensity of msgn1 normalized to hsWT dynamic range at successive time points. Mean ± s.d. *P<0.01, **P<0.001. Scale bars: 50 µm.
                
                    
                        Image


                        Figure Caption


                        Figure Data


                        Acknowledgments


This image is the copyrighted work of the attributed author or publisher, and
ZFIN has permission only to display this image to its users.
Additional permissions should be obtained from the applicable author or publisher of the image.
      Full text @ Development