
|
Fig. 5
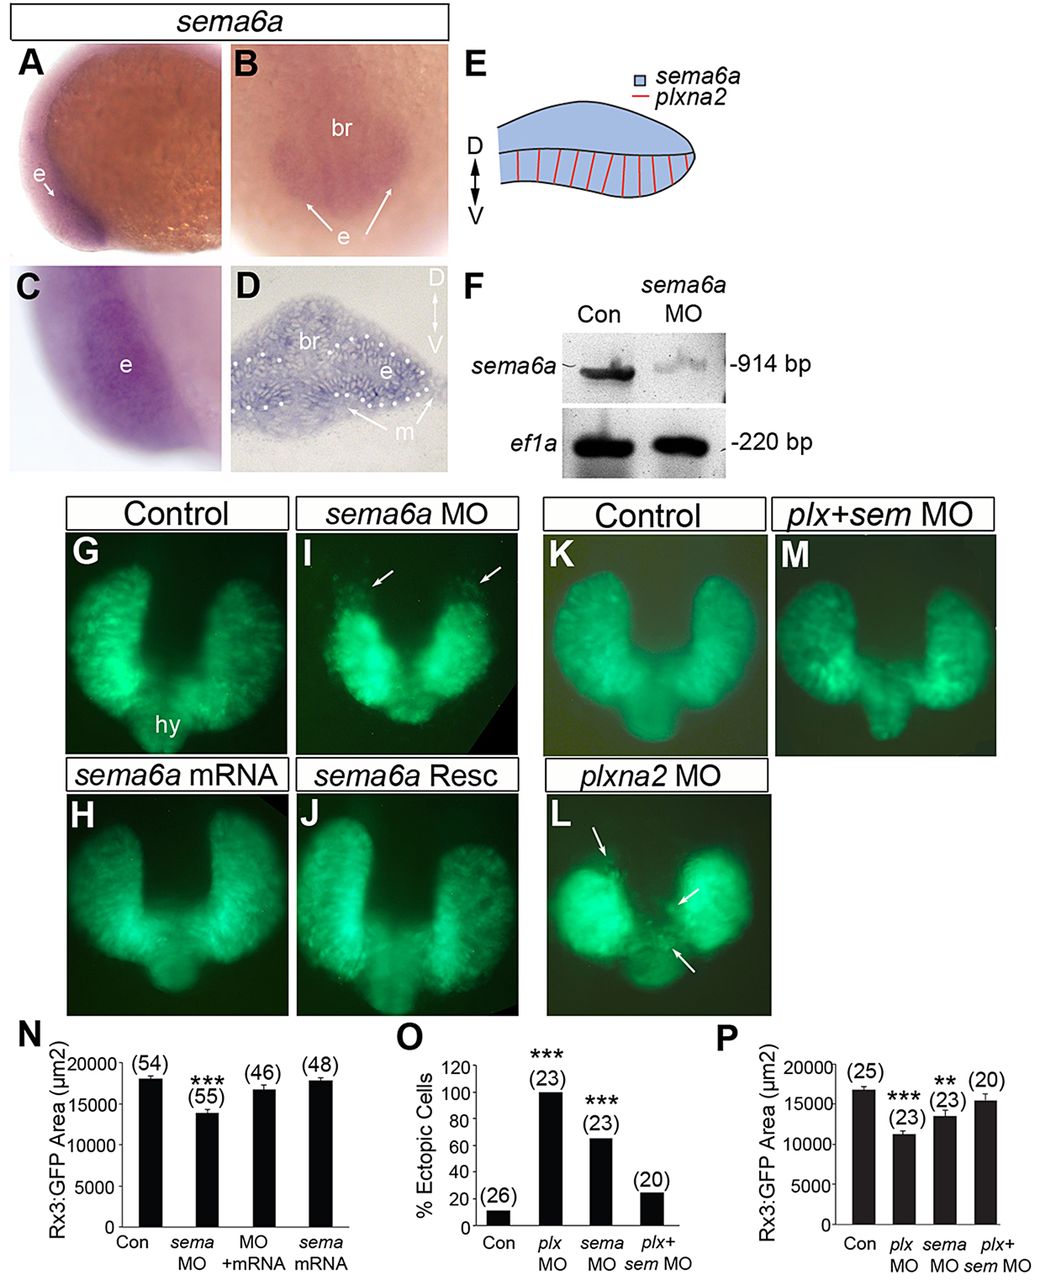
Plxna2 and Sema6a function together in eye cohesion. (A-D) RNA in situ hybridization for sema6a viewed in lateral wholemounts (A-C) and in a transverse section (D). At 4 (A), 6 (B) and 12 somites (C,D), sema6a is expressed in the brain (br), and both the dorsal and ventral vesicle (e), but not the mesenchyme (m; arrows). (E) Schematic of a transverse view of eye vesicle depicting sema6a (blue) throughout and plxna2 (red) restricted ventrally. (F) RT-PCR indicates a knockdown of sema6a mRNA in the morphants because of mis-splicing of exon 1. (G-J) Dorsal images of 12-somite rx3:GFP transgenic eyes for control (G), sema6a morphant (I), full-length zebrafish sema6 mRNA-injected embryo (H) and sema6a morphant rescued with sema6a mRNA (J). (K-M) Dorsal views of 12-somite control (K), plxna2 morphant (L) and plxna2 and sema6a double morphant (M) rx3:GFP eye vesicles. Ectopic GFP+ cells are seen around, and at the midline between, the eye vesicles (arrows). (N) Mean area of the 12-somite GFP+ eye vesicles of control, and embryos co-injected with the sema6a MO, with or without sema6a mRNA. n=3. Numbers of embryos in brackets. ***P<0.001, one-way ANOVA, Newman-Keuls test. (O,P) Percentage of ectopic GFP+ cells (O) and the GFP+ eye vesicle area (P) in control and morphant embryos. Error bars indicate s.e.m., numbers of embryos are in brackets. n=3. (O) Chi-square ***P<0.001; (P) ***P<0.001, **P<0.01 unpaired one-way ANOVA, Bonferroni′s test.