
|
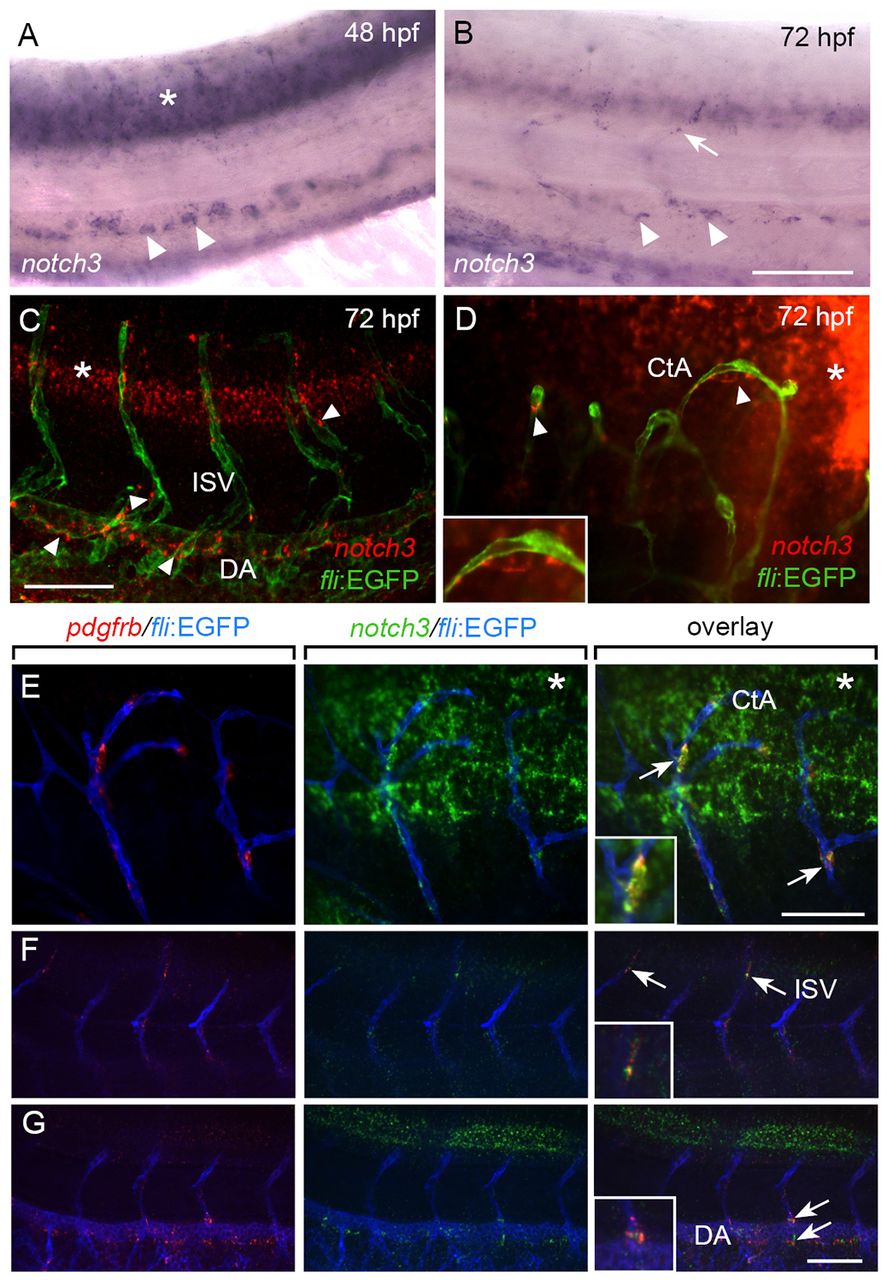
Fig. 2
Zebrafish pericytes express notch3. (A,B) notch3 expression in the trunk vessels. Arrowheads, DA; arrow, ISVs; asterisk, neural expression. (C,D) Fluorescence ISH showing notch3 expression in trunk (C) and brain pericytes (D). Arrowheads indicate notch3+ pericytes and asterisk marks neural expression. Inset shows a high magnification view of a notch3+ pericyte. (E) Double fluorescence ISH showing colocalization of pdgfrb and notch3 transcripts in brain pericytes. Asterisks mark neural expression of notch3. (F,G) Double fluorescence ISH showing colocalization of pdgfrb and notch3 transcripts in trunk vessels. (F) Confocal section showing ISV pericytes. (G) DA mural cells. Arrows indicate pdgfrb+ notch3+ pericytes. Insets show high magnification views of pdgfrb and notch3 co-expression in pericytes. CtA, central artery; DA, dorsal aorta; ISV, intersegmental vessels. Scale bars: 200 μm.