
|
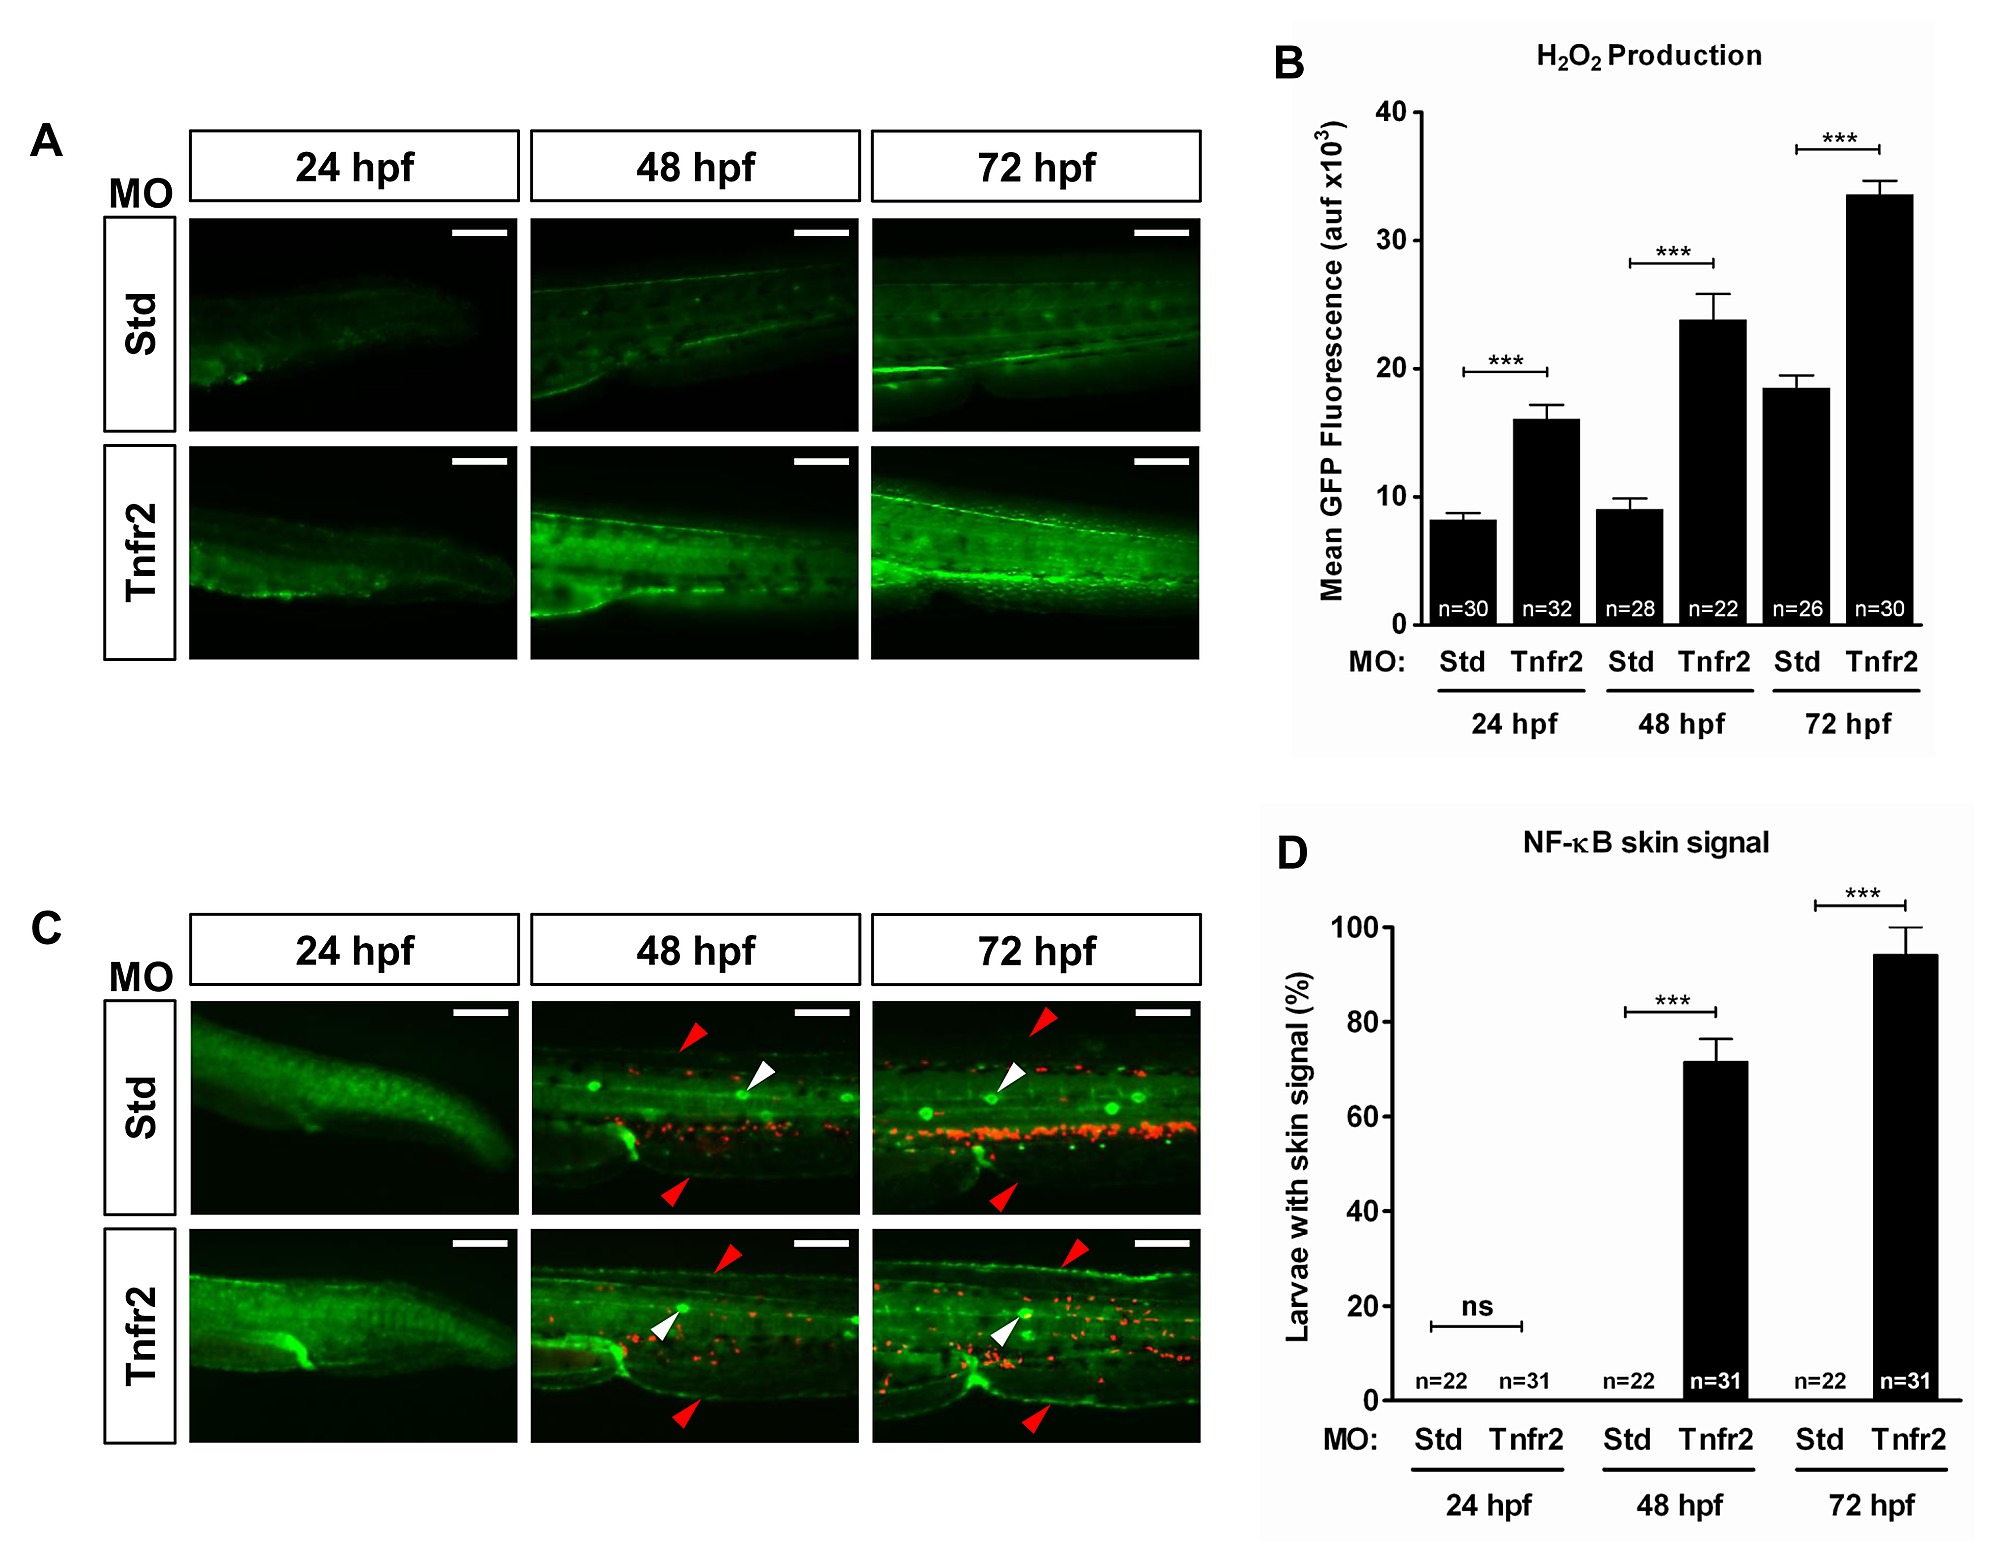
Fig. S8
H2O2 production by Tnfr2-deficient keratinocytes preceded the activation of NF-κB. Zebrafish one-cell wild-type (A, B) or lyz:dsRED; NF-κB:eGFP (C, D) embryos were injected with standard control (Std) or Tnfr2 MOs. (A, B) Larvae were dechorionated at 24 hpf and then labeled with 50 μM acetyl-pentafluorobenzene sulphonyl fluorescein at 24, 48, and 72 hpf. Representative images of green channels of Std and Tnfr2 morphants (A) and quantification of green fluorescence in the indicated number of larvae (B) are shown. Note that increased H2O2 production by skin keratinocytes is already observed at 24 hpf. (C) Representative pictures showing NF-κB activation levels in control and Tnfr2-deficient larvae at 24, 48, and 72 hpf. Note that NF-κB is induced in the skin (red arrowheads) of Tnfr2-deficient larvae at 48 h and that neutrophil dispersion is observed at 72 hpf and, to some extent, at 48 hpf. The neuromasts are indicated with white arrowheads. (D) Quantification of the percentage of larvae showing activation of the NF-κB in the skin. The results are shown as the mean ± S.E.M. The number of larvae analyzed is also indicated. Scale bars, 100 μm. ns, not significant; auf, arbitrary units of fluorescence. *p<0.05; **p<0.01; ***p<0.001.