
Image
|
Figure Caption
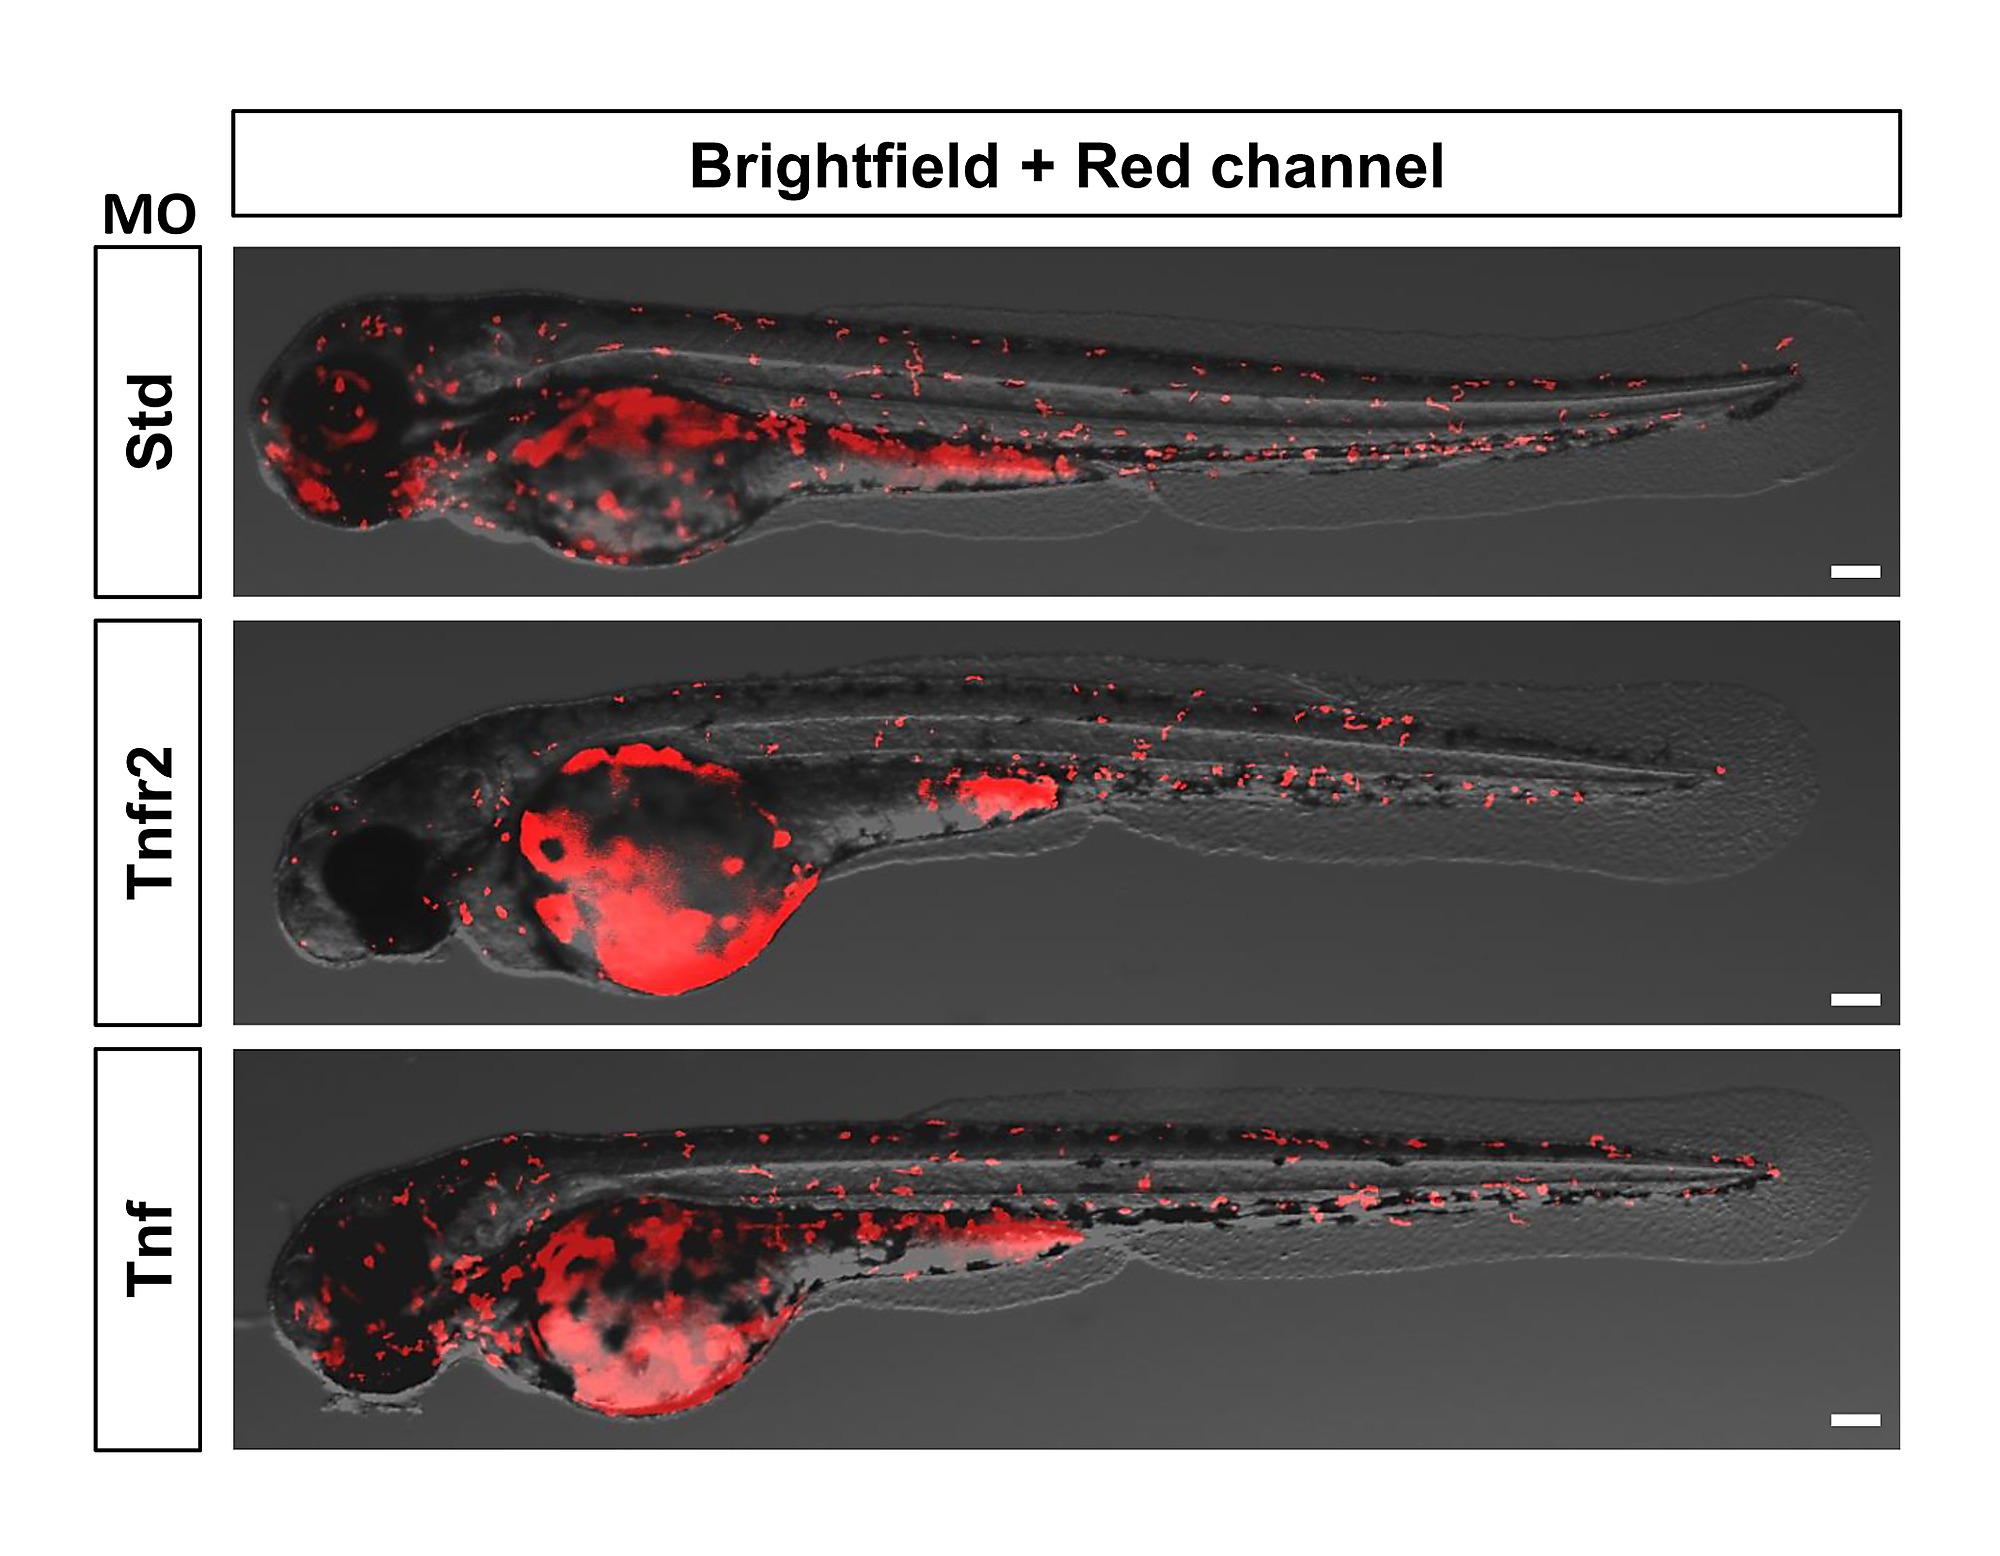
Fig. S2
Macrophage distribution is not altered in Tnfa- or Tnfr2-deficient larvae. Zebrafish one-cell mpeg1:eGFP embryos were injected with standard control (Std), Tnfr2, and Tnfa MOs. Representative images showing macrophage distribution in 72 hpf larvae. Scale bars, 100 μm.
Acknowledgments
This image is the copyrighted work of the attributed author or publisher, and
ZFIN has permission only to display this image to its users.
Additional permissions should be obtained from the applicable author or publisher of the image.
Full text @ PLoS Biol.