
|
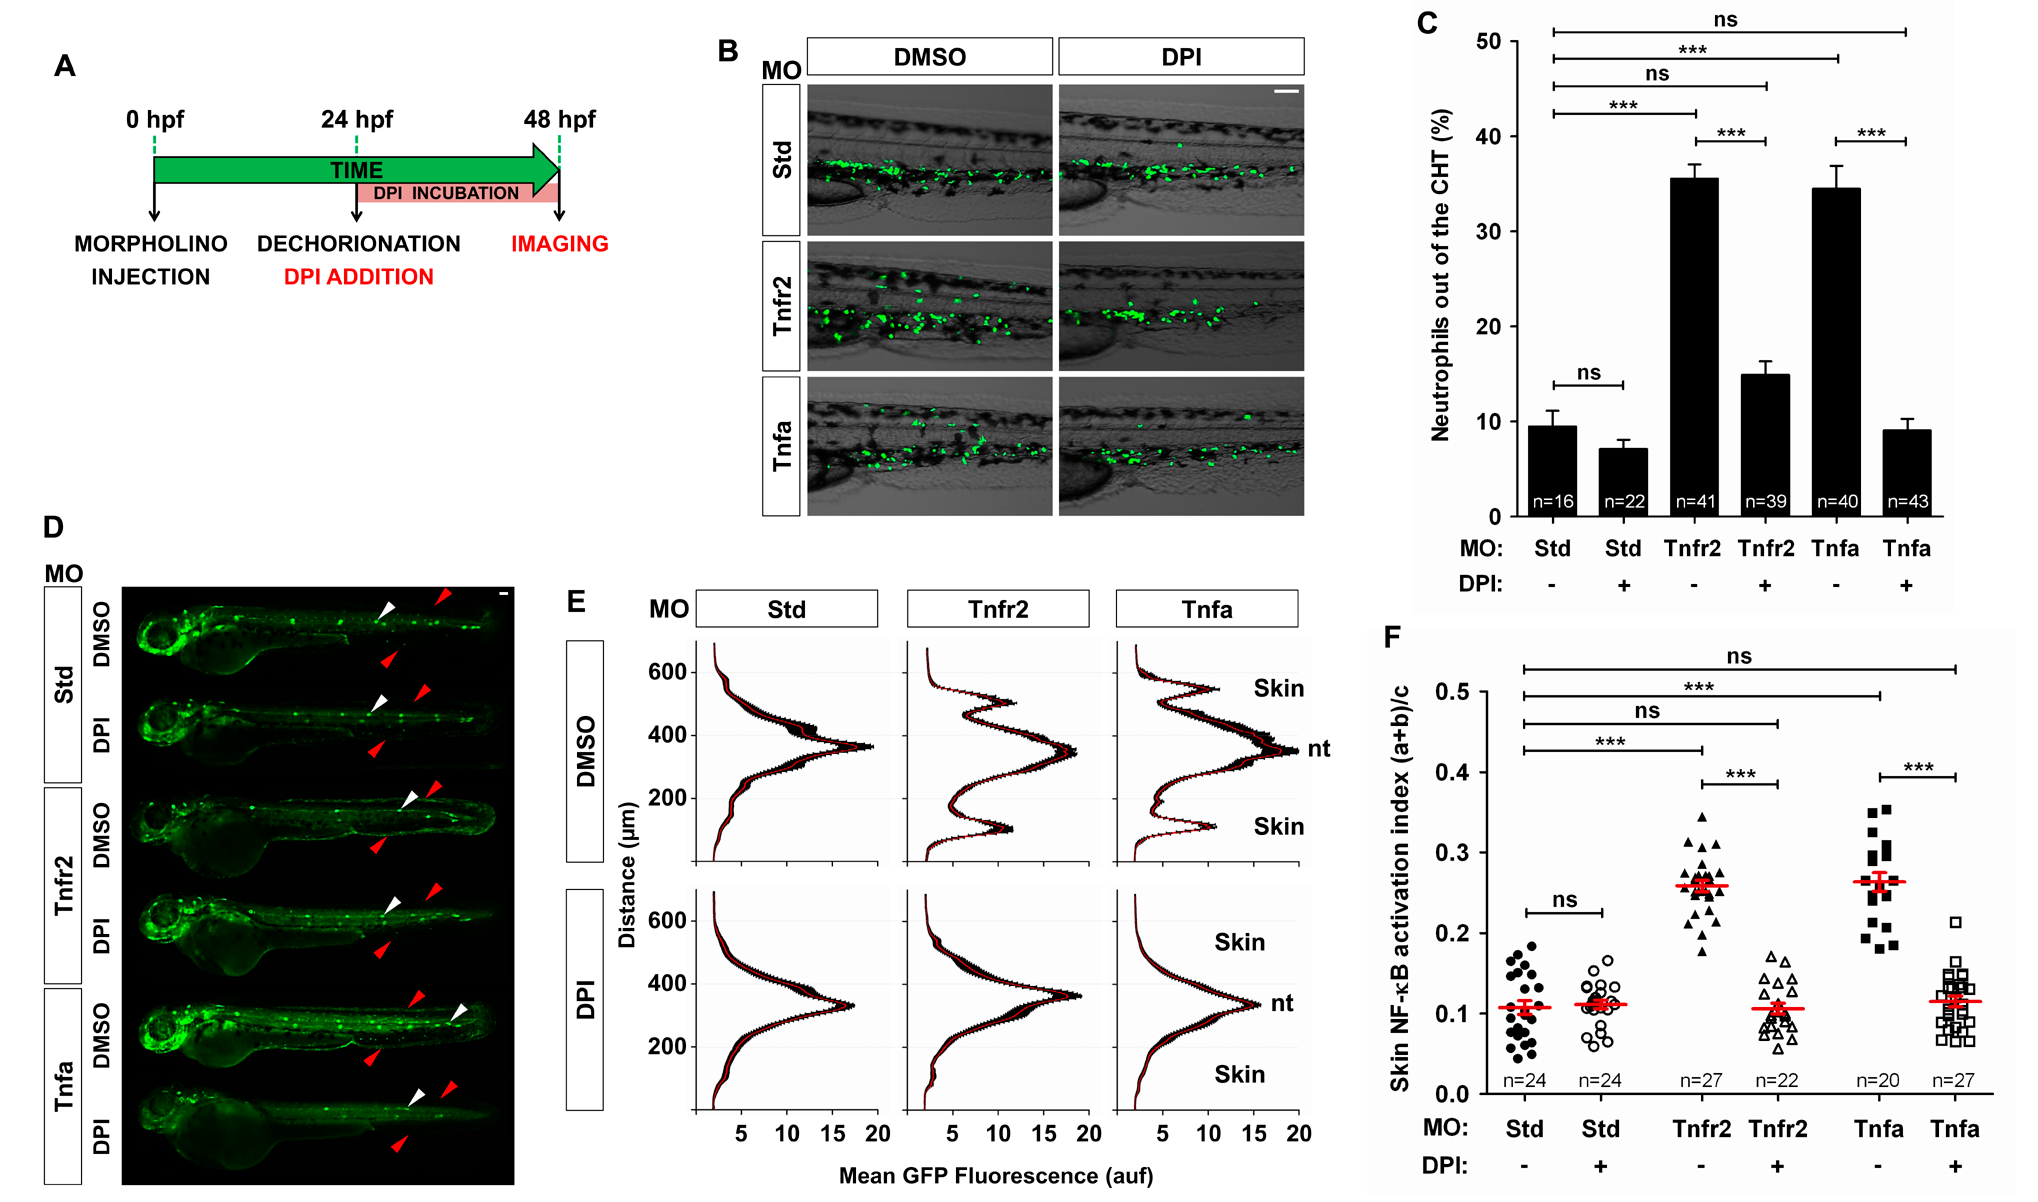
Fig. 6
Pharmacological inhibition of Duox1 prevents skin inflammation in Tnfa- and Tnfr2-deficient zebrafish.
Zebrafish one-cell mpx:eGFP (B, C) and NF-κB:eGFP (D–F) embryos were injected with standard control (Std), Tnfr2, or Tnfa MOs. (A) Scheme showing the experimental procedure: embryos were dechorionated at 24 hpf and treated by immersion in 100 µM DPI or vehicle alone (DMSO) for 24 h. (B, C) Representative images of bright field and green channels of the morphants at 48 hpf showing the differences in the neutrophils distribution (B) and quantification of neutrophil mobilization from the CHT to the skin in the indicated number of larvae per group from three different experiments (C). (D–F) Quantification of NF-κB activation in the skin of Tnfr2- and Tnfa-deficient larvae at 72 hpf. (E) Fluorescence intensity was measured for all the groups in the area indicated, as explained in the legend to Figure 1 (15 larvae per treatment from 3 different experiments). The skin and the notochord (nt) have been labeled to facilitate the larval orientation. Note the activation of NF-κB in the skin (red arrowheads) of Tnfr2-deficient larvae. Note the strong expression of NF-κB in neuromasts (white arrowheads). (F) Skin NF-κB activation index was defined as the fluorescence in the skin (a+b) relative to the total fluorescence of the whole larvae (c). Each dot represents the skin NF-κB activation index per single larva. The mean ± S.E.M. of the skin NF-κB activation index for each group of larvae is also shown. Scale bars, 100 μm. ns, not significant. ***p<0.001.