
|
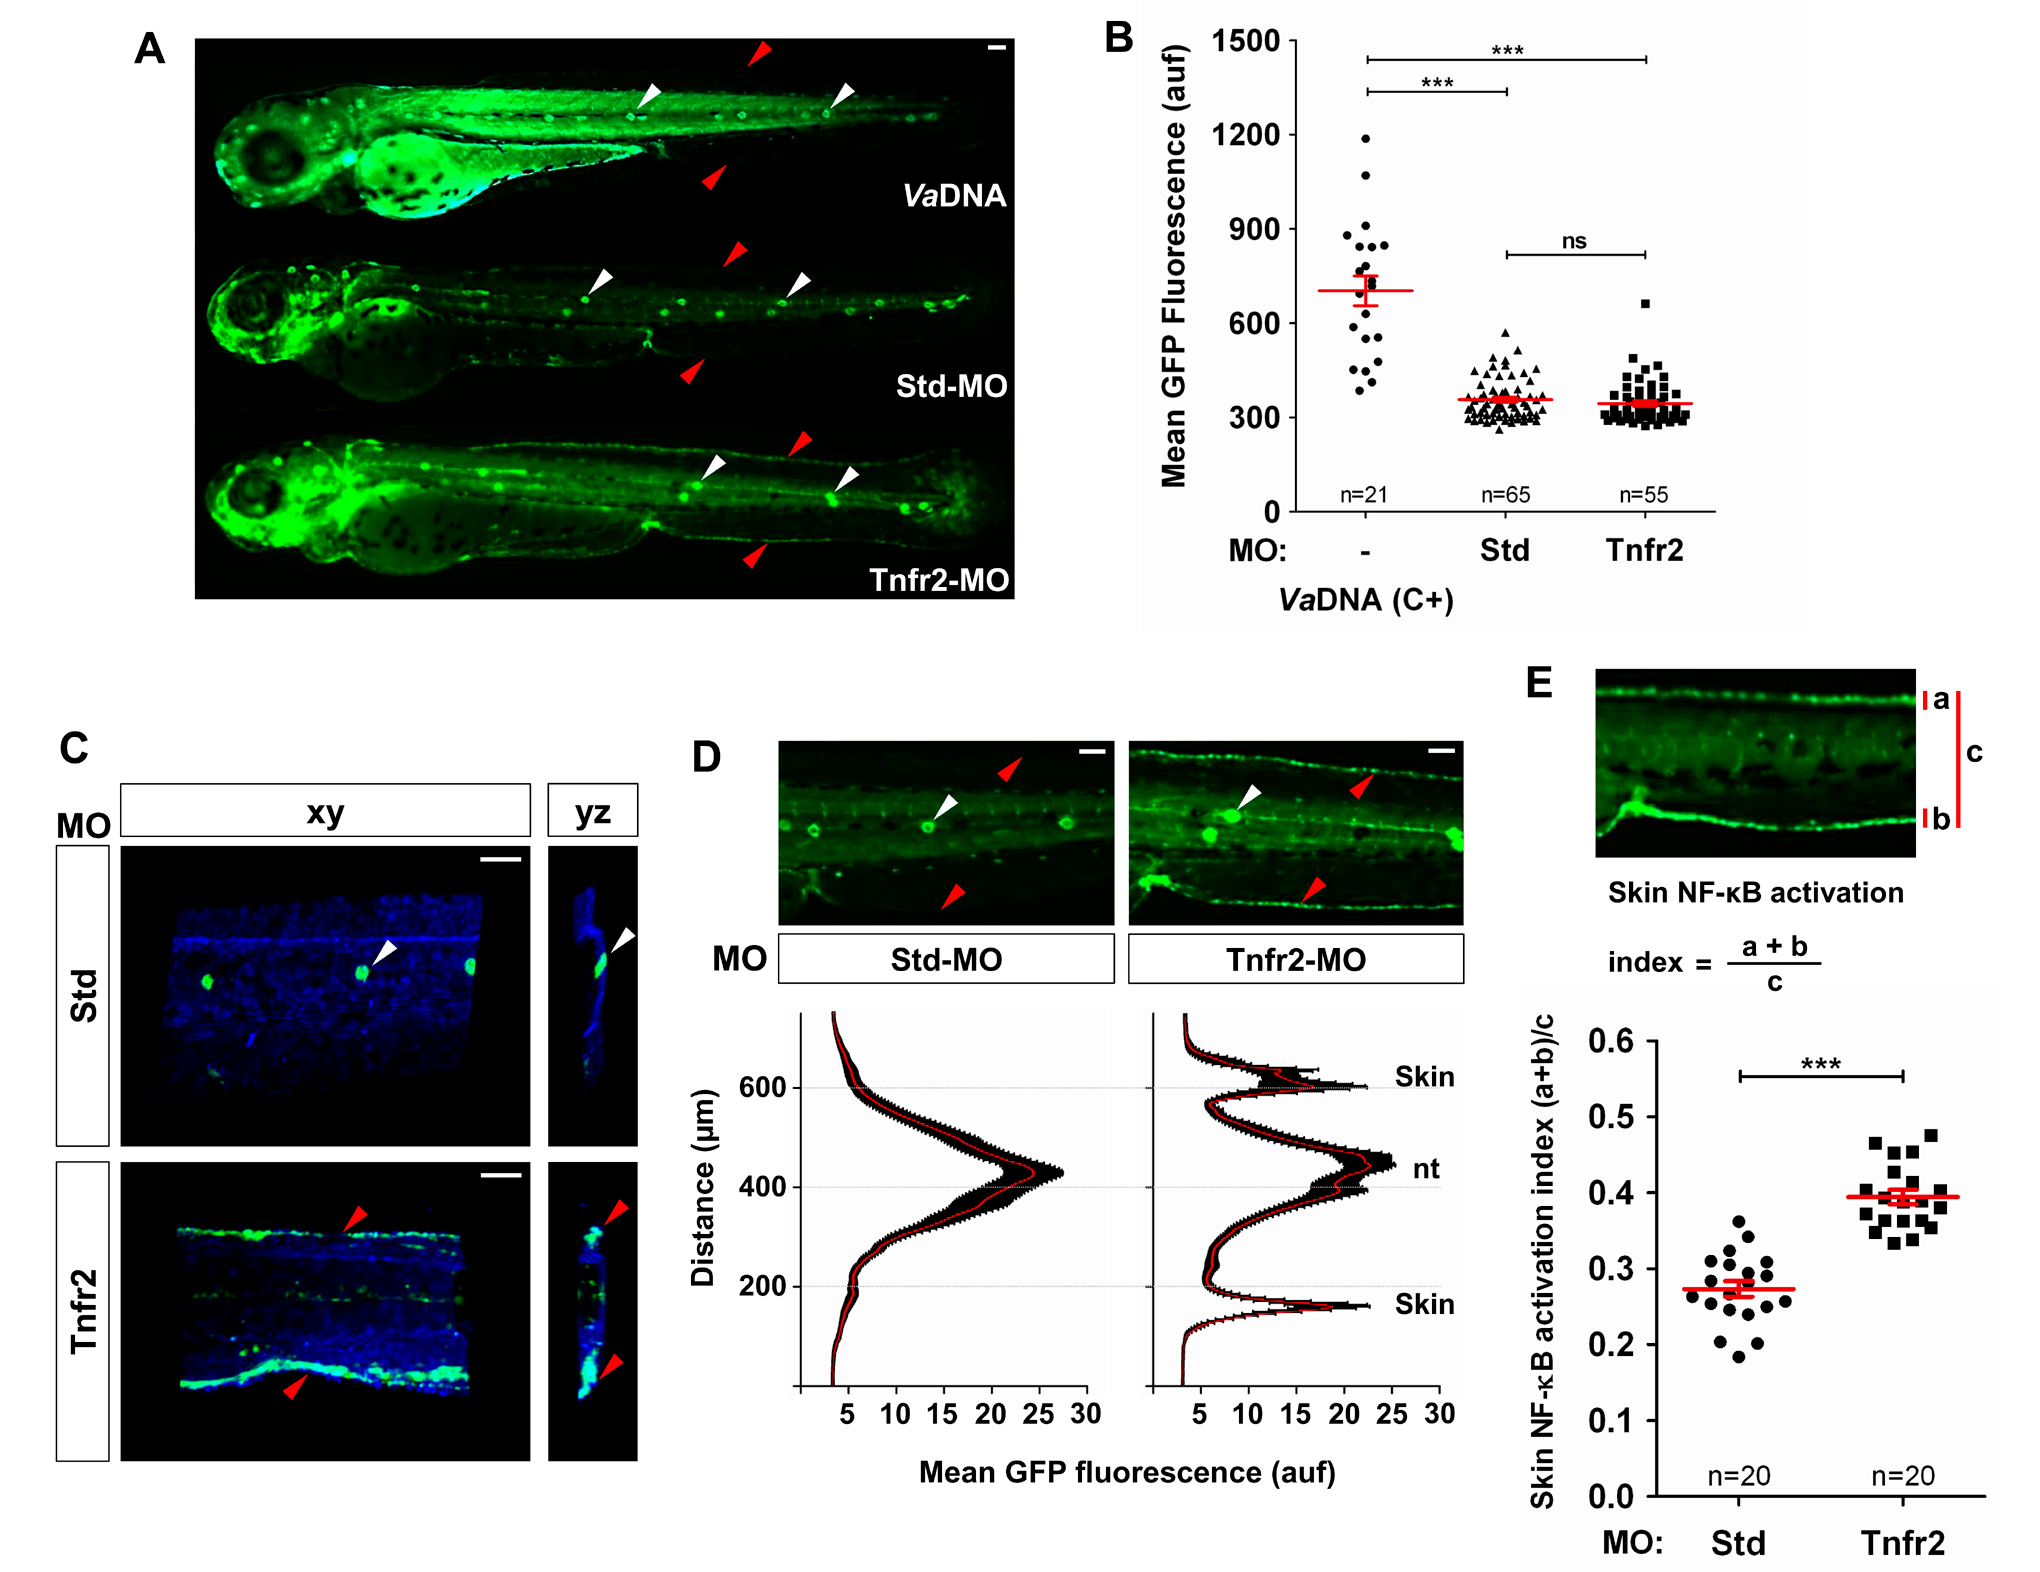
Fig. 3
Tnfa and Tnfr2 deficiencies result in skin NF-κB activation.
Zebrafish one-cell NF-κB:eGFP (A, B, D, E) or NF-κB:eGFP; krt18:RFP (C) embryos were injected with standard control (Std) or Tnfr2 MOs alone or in the presence of 2.3 ng/egg of V. anguillarum genomic DNA (VaDNA), as a positive control for NF-κB activation. (A) Representative pictures showing the induction of NF-κB activation in the skin (red arrowheads) of Tnfr2-deficient larvae at 72 hpf and the ubiquitous, strong induction in their VaDNA-injected siblings. Note the strong expression of NF-κB in neuromasts of control larvae (white arrowheads). (B) The mean GFP fluorescence was quantified in whole larvae, and no significant differences between Tnfr2-morphants and control larvae were observed. Each dot represents the mean GFP fluorescence per single larva. The mean ± S.E.M. of the whole GFP fluorescence for each group of larvae is also shown. (C) Representative frontal (xy) and lateral (yz) views of tridimensional reconstructions from confocal microscopy images of WIHC of NF-κB:eGFP; krt18:RFP larvae stained at 3 dpf with anti-RFP antibodies (keratinocytes, blue) showing the induction of NF-κB in the skin (eGFP, green) of Tnfr2-deficient larvae. (D, E) Quantification of NF-κB activation in the skin of Tnfr2-deficient larvae at 72 hpf. (D) Fluorescence intensity was measured in the area indicated of wild-type and Tnfr2-deficient larvae, as explained in the legend to Figure 1 (15 larvae per treatment from 3 different experiments). The skin and the neuromasts have been labeled to facilitate the larval orientation. Note the activation of NF-κB in the skin of Tnfr2-deficient larvae. (E) The skin NF-κB activation index was defined as the fluorescence in the skin (a+b) relative to the total fluorescence of the whole larvae (c). Each dot represents the skin NF-κB activation index per single larva. The mean ± S.E.M. of the skin NF-κB activation index for each group of larvae is also shown. Scale bars, 100 μm. ns, not significant; auf, arbitrary units of fluorescence. *p<0.05; **p<0.01; ***p<0.001.