
|
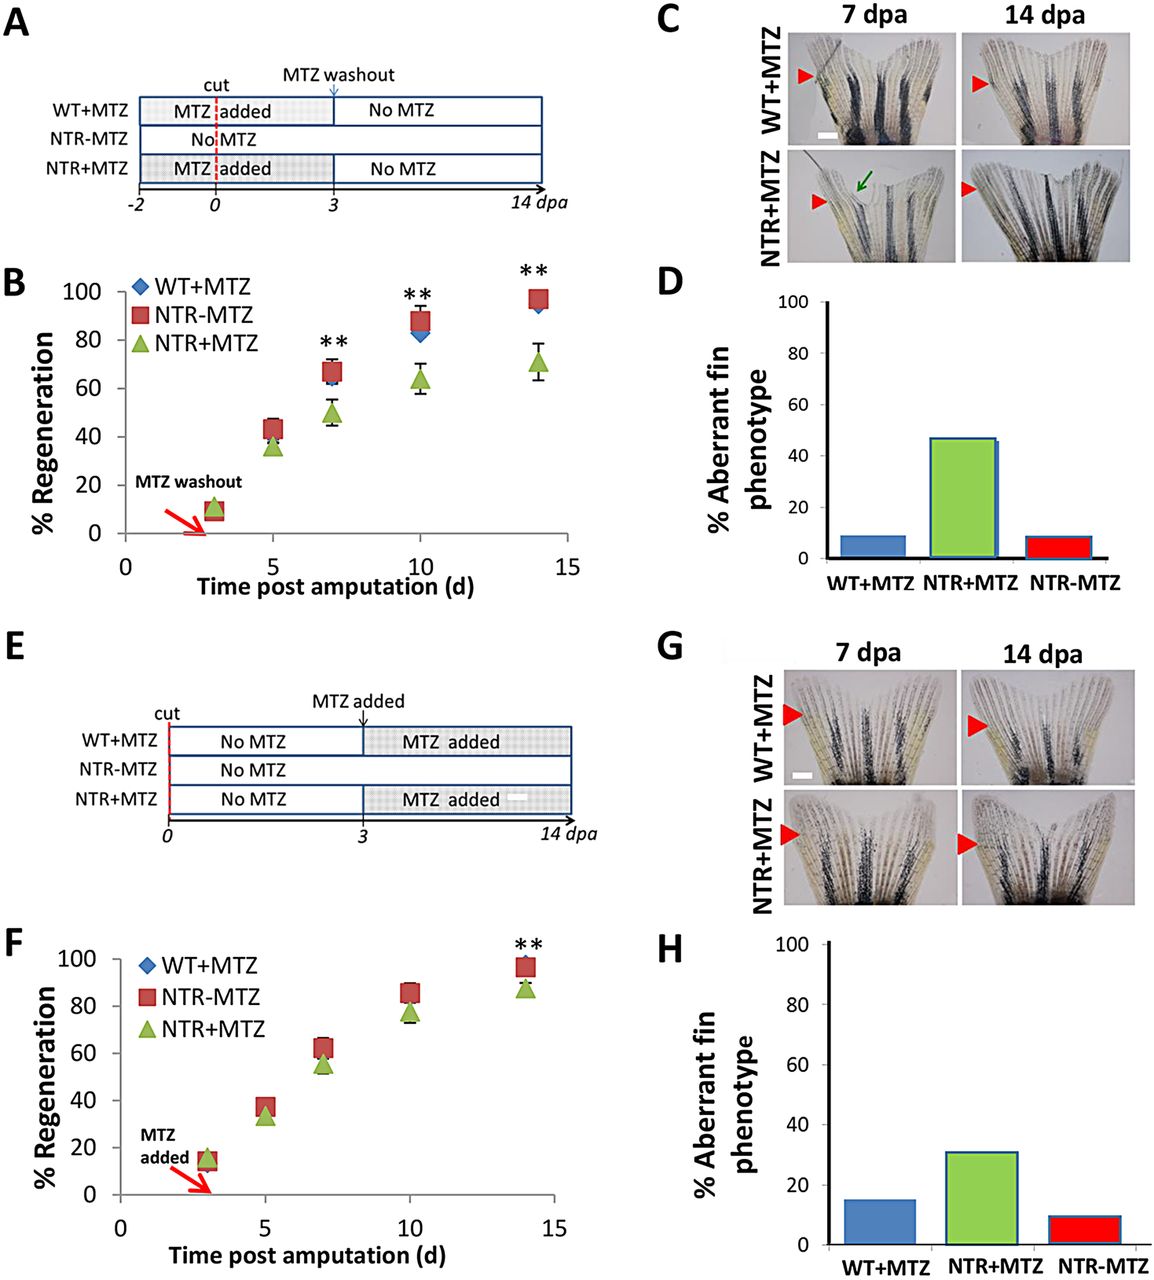
Fig. 5
Macrophages exhibit stage-dependent effects on fin regeneration. (A) Experimental scheme. Macrophages were ablated after fin resection through 3dpa, then allowed to repopulate normally via MTZ washout. (B) Representative fin images at 7 and 14dpa, which is 4 and 11days after macrophage repopulation initiation, respectively. Green arrow indicates irregular fin phenotype, as dictated by non-homogenous growth areas; red arrows indicate original resection plane. (C) Macrophage reduction through 3dpa largely recapitulated the reduction in regenerative outgrowth seen with 14days ablation. Rate of tissue regeneration was reduced in NTR+MTZ (n=11) fish compared with WT+MTZ (n=7) and NTR-MTZ (n=10) fish. Data are averaged over two separate experiments using identical conditions. 7dpa, **P=0.0455; 10dpa, **P=0.0278; 14dpa, **P=0.0220; two-tailed t-test. (D) Quantification of percentage of fish displaying any aberrant phenotype at 14dpa. Total quantification is cumulative from two separate experiments. (E) Experimental scheme. Macrophages were ablated beginning at 3dpa through 14dpa. (F) Representative images at 7 and 14dpa, which is 4 and 11days after the ablation of macrophages had begun, respectively. (G) Delayed macrophage reduction did not significantly reduce the rate of regeneration. Data are averaged over two separate experiments using the same conditions. (H) Quantification of the percentage of fish displaying any aberrant phenotype at 14dpa. Data are cumulative from two separate experiments. Error bars indicate s.e.m. Scale bars: 300μm.