
|
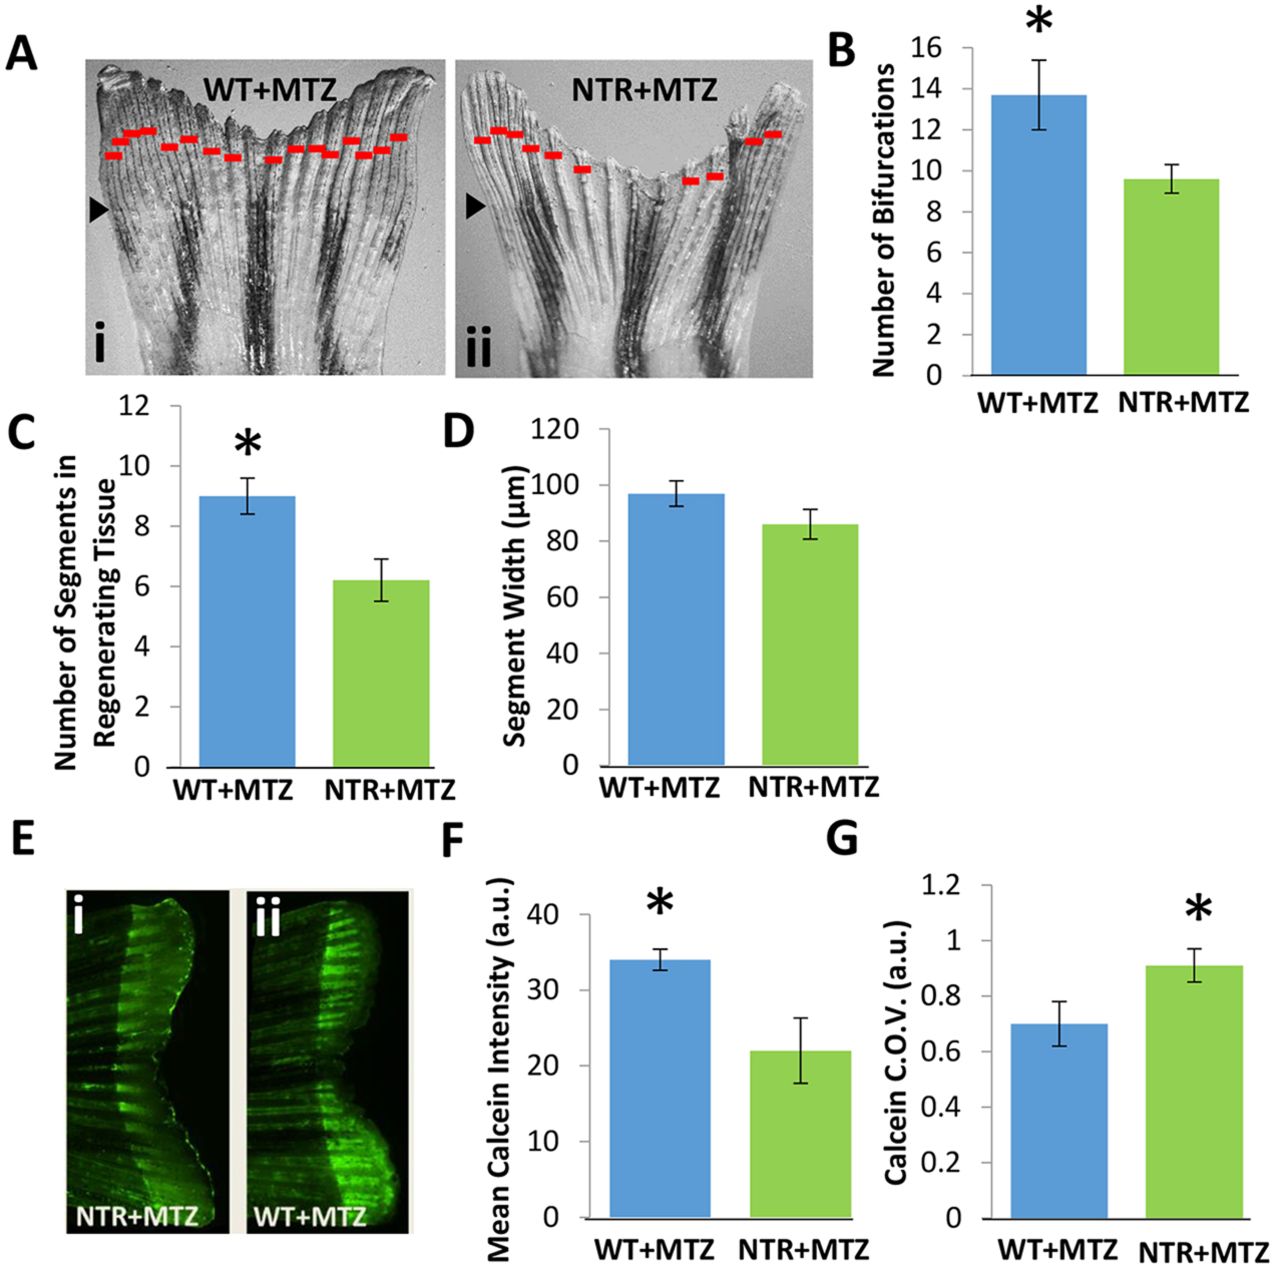
Fig. 3
Macrophages modulate bony ray patterning and formation during tissue outgrowth. Macrophages were continuously ablated up to 10dpa. (A) Representative fin images of NTR+MTZ (ii) versus control (i) for at least two independent experiments. Red bars indicate bifurcation points on each ray. Black arrowheads indicate the original fin cut line. (B) Total bifurcations in regenerated tissue are decreased in NTR+MTZ fish compared with wild-type fish. *P=0.030 (two-tailed t-test, error bars indicate s.e. m.). (C) The average number of total segments in each regenerated bony ray is decreased in NTR+MTZ fish compared with WT+MTZ fish. *P=0.040 (two-tailed t-test, error bars indicate s.e.m.). (D) Average segment width for NTR+MTZ and control fins. No significant differences were observed. (E) Fluorescent images of calcein staining in (ii) WT+MTZ and (i) NTR+MTZ fish. Note the less intense and more scattered staining in NTR+MTZ fins compared with WT+MTZ fins. (F) Mean calcein intensity is decreased in NTR+MTZ fish compared with WT+MTZ fish. *P=0.044 (two-tailed t-test, error bars indicate s.e.m.). (G) Coefficient of variation (C.O.V.; a measure of dispersion) for calcein intensity is significantly increased in NTR+MTZ fish compared with wild-type fish. *P=0.047 (two-tailed t-test, three separate experiments, error bars indicate s.e.m.).