
|
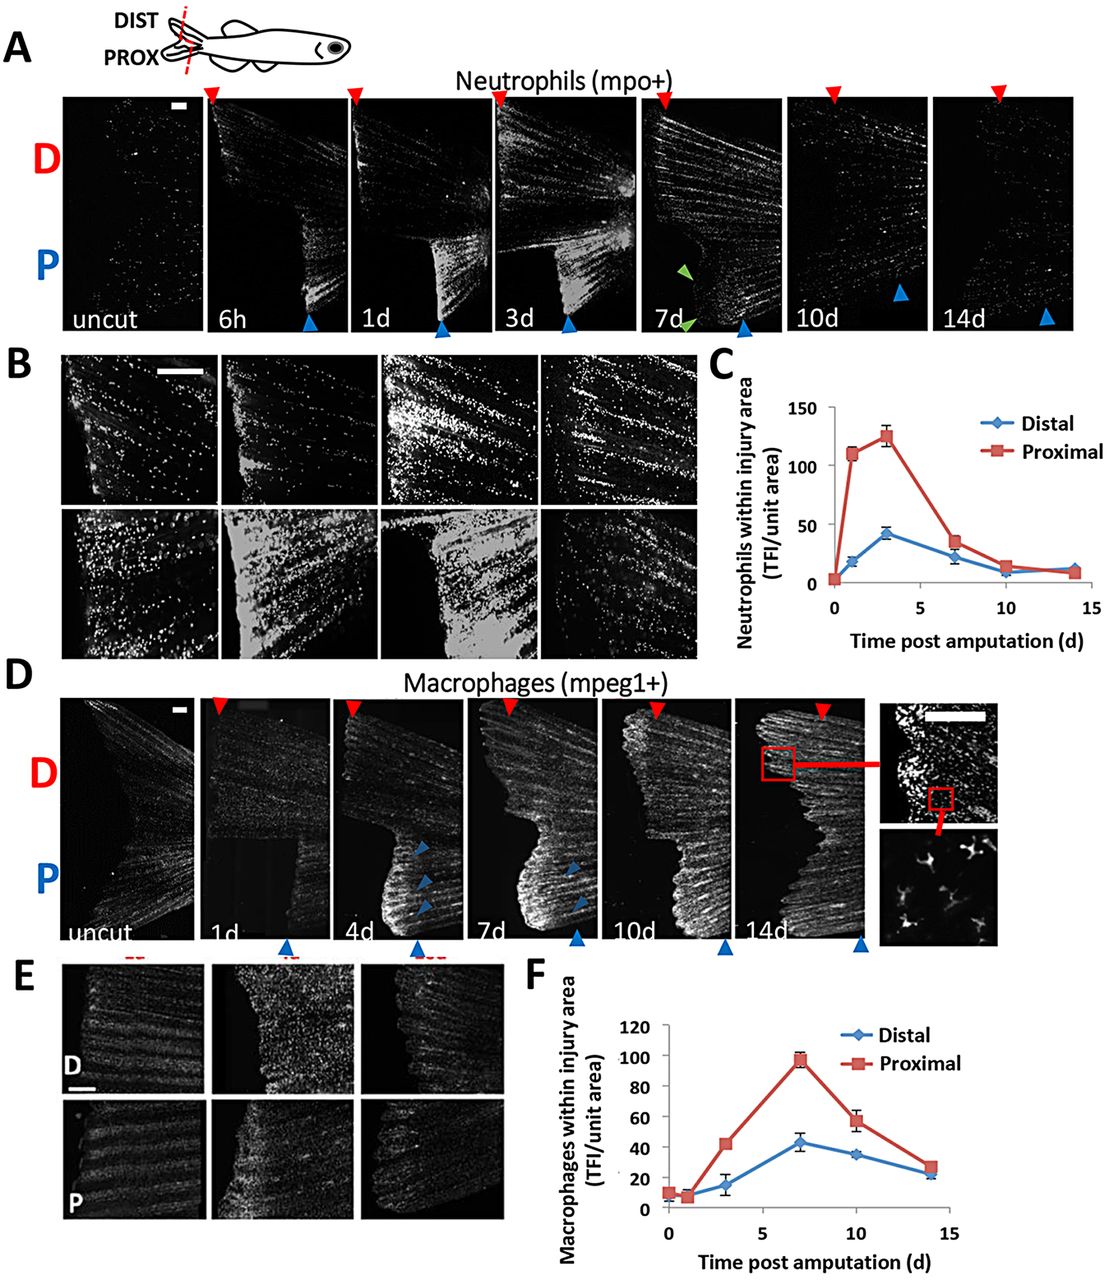
Fig. 1
Leukocyte recruitment in regenerating caudal fins follows distinct timelines and aligns with positional memory. (A,B) Representative images detailing a regenerative timecourse of neutrophil accumulation in Tg(mpo:GFP) amputated fish, from uncut through 14dpa. Fish received a dorsal proximal cut (indicated by ‘P’) and a ventral distal cut (‘D’). Fluorescent images were acquired and converted to grayscale for visualization. (C) Neutrophil density was quantified separately for the resected edge of both the proximal and distal cuts (n=9). Total fluorescence intensity of GFP-positive cells was normalized to the injured fin area and used as a correlation for cell number (see Materials and Methods). TFI, total fluorescence intensity. (D,E) Using the same strategy as above, macrophages were tracked in Tg(mpeg1:mCherry) fish during 14days of regeneration. Boxes indicate regions magnified. (F) Quantification of macrophages near the amputation planes for proximal and distal cuts (n=10). Both neutrophils and macrophages accumulate in greater numbers in more proximal (faster regenerating) compared with distally cut tissue. Error bars indicate s.e.m. averages of each experiment. Scale bars: 200μm.