
|
Fig. S6
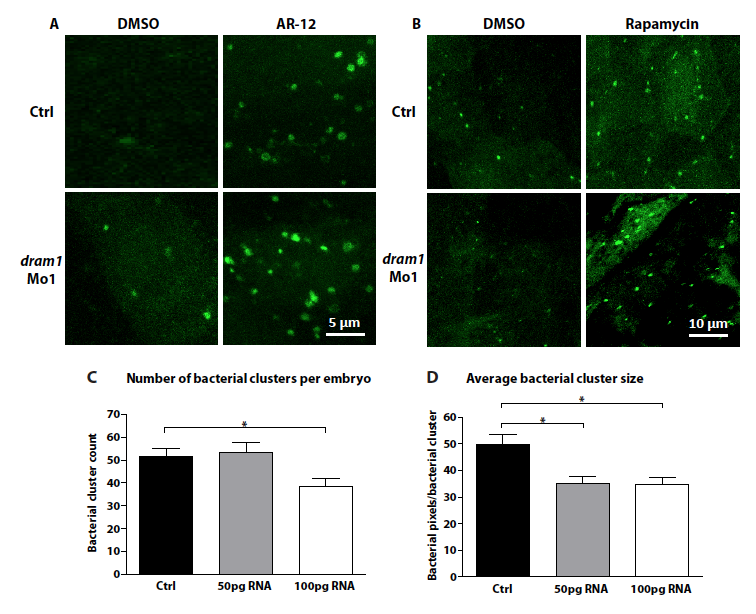
Dram1 RNA and defense against mycobacterial infection.
(A-B) The autophagy response initiated by Dram1 is distinct from that initiated by Ar-12 or rapamycin treatment. Representative confocal micrograph of standard control or dram1 morpholino injected embryos treated with (A) Ar-12, (B) rapamycin, or DMSO as a control. Embryos were treated at 2dpf for 24 hours.
(C-D) Dram1 overexpression effect on the formation of granuloma-like aggregates. Wild type embryos were mockinjected or injected with 50 or 100 pg dram1 RNA immediately after fertilization. Embryos were infected with 200 CFU Mm at 1 dpf. Whole embryo stereo fluorescent micrographs were taken at 3 dpi and (A) the total number of bacterial clusters and (B) the average bacterial cluster size were determined using dedicated software (Stoop et al., 2010). Data (mean ± SEM) is pooled from two individual experiments (n>94 embryos per group). Significant differences were calculated by one-way ANOVA with Tukey’s Multiple Comparison method as a post-hoc test (*= p<0.05). Significant reduction of both the total number of clusters and cluster size by dram1 overexpression is in agreement with the reduction of total bacterial pixel counts shown in figure 6C.