
|
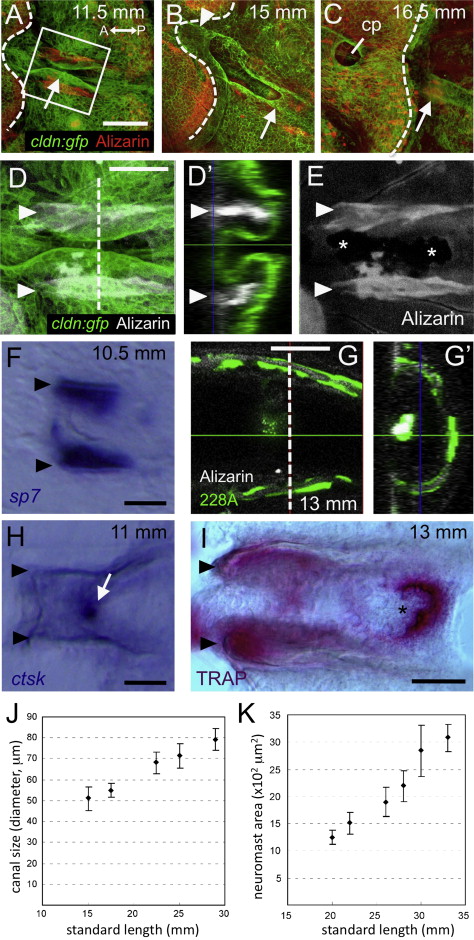
Fig. 3
The canal forms through a bone remodeling process. (A–C) Canal structures are imaged in cldn:gfp larvae and juveniles stained with Alizarin red at 11.5 mm SL (A), 15 mm SL (B) and 16.5 mm SL (C). Positions of neuromasts are indicated by arrows. Caudal margins of scales are indicated by dotted lines. (D, D2, and E) Higher magnification images of the area indicated in A, with the red channel converted to white for clarity. Canal walls are lined with dermal bones (indicated by arrowheads). An optical cross section is shown in D2. Resorption pits are visible along the scale plate in E (asterisks). (F) Expression of sp7 gene along the canal walls (indicated by arrowheads). (G and G2) GFP-expressing osteoblasts are associated with the canal roof in SAGFF(LF)228A enhancer trap fish. (H) Expression of ctsk gene along resorption pits (arrow). (I) TRAP activity was detectable along the canal walls and most intensely at the level of resorption pits. (J and K) The canal diameters (J) and neuromast areas (K) were correlated to standard length of fish. Mean±SEM is indicated. Scale bars: 100 μm in A–C, 50 μm in D–I.
Reprinted from Developmental Biology, 392(1), Wada, H., Iwasaki, M., Kawakami, K., Development of the lateral line canal system through a bone remodeling process in zebrafish, 1-14, Copyright (2014) with permission from Elsevier. Full text @ Dev. Biol.