
|
Fig. 2
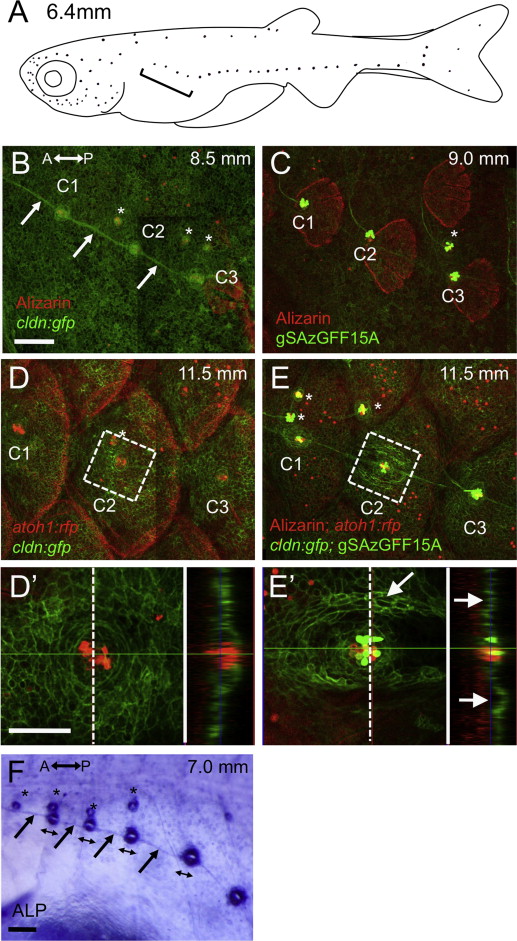
Development of the lateral line scale. (A) Schematic distribution of neuromasts in larval fish, indicated by dots. The first few neuromasts on the anterior trunk region become canal neuromasts (indicated by bracket). (B–E) The first three canal neuromasts (indicated by C1–C3) in larvae stained with Alizarin red at 8.5 mm SL (cldn:gfp, B), 9.0 mm SL (gSAzGFF15A; UAS:gfp, C), and 11.5 mm SL (cldn:gfp; atoh1:rfp, D, cldn:gfp; atoh1:rfp; gSAzGFF15A; UAS:gfp, E). The atoh1:rfp and gSAzGFF15A enable visualization of hair cells. (D2 and E2) Higher magnification of the area shown in D and E, with optical cross sections shown in the right panels. The first sign of canal formation was detected as a pair of ridges along the lateral line (indicated by arrows in E2). (F) Alkaline phosphatase staining showing anisotropy of the canal neuromasts, and an unlabeled central region of neuromast elongating along the axis of hair cell polarity (indicated by double-headed arrows). Arrows indicate interneuromast cells. Asterisks indicate superficial neuromasts. Lateral views; anterior is to the left. Scale bars: 100 μm in B–F, 50 μm in D2 and E2.
Reprinted from Developmental Biology, 392(1), Wada, H., Iwasaki, M., Kawakami, K., Development of the lateral line canal system through a bone remodeling process in zebrafish, 1-14, Copyright (2014) with permission from Elsevier. Full text @ Dev. Biol.