
|
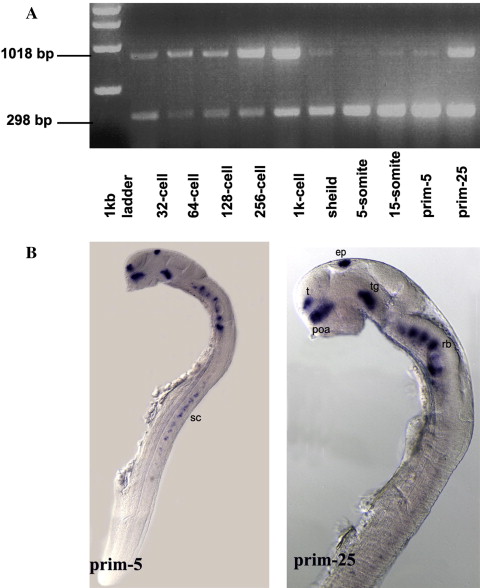
Fig. 2 Zebrafish nxph1 expression during embryonic development. (A) RT-PCR showing the presence of maternal nxph1 in zebrafish embryos. Lane 2–11: cDNA amplified from total RNA of 32-cell, 64-cell, 128-cell, 256 cell, 1000-cell, shield, 5-somite, 15-somite, prim-5 and prim-25 stage embryos, respectively. (B) Lateral view: anterior to the left of embryos at prim-5 and prim-25. nxph1 is expressed in discrete clusters in the forebrain, midbrain, hindbrain and spinal cord. Abbreviations: t, telencephalon; pOA, post-optic area; e, epiphysis; tg, tegmentum; rh, rhombomeres; sc, spinal cord. Scale bar = 100 µm.
Reprinted from Gene expression patterns : GEP, 13(8), Thomas-Jinu, S., and Houart, C., Dynamic expression of neurexophilin1 during zebrafish embryonic development, 395-401, Copyright (2013) with permission from Elsevier. Full text @ Gene Expr. Patterns