
|
Fig. S4
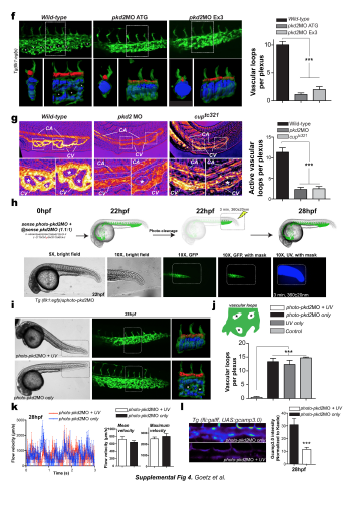
a. Calcium content in the developing DA was quantified and images of tnnt2 morphants are provided. b. Calcium content in the DA was evaluated in 28 hpf cmlc1 morphants. c. Overall endothelial cell number was quantified in the indicated embryos. d. Calcium content in the developing DA was evaluated in pkd2 morphants. Quantification is shown in (a). e. Immunolocalization of PKD2 in the caudal plexus of Tg(β-actin:Arl13b-GFP). Expression of PKD2 is strong in membranes localized at the base of endothelial cilia in whole and dissected embryos. f. Vascular morphogenesis of the caudal vein was assessed in additional pkd2 morphants at 28 hpf. Asterisks point to vascular loops which are mostly absent in pkd2 morphants. 3D models of the vascular lumens of a delimited region (2 somites) of the caudal plexus was performed and are displayed as orthogonal and side views. The CA was colored in red and the CV in blue. Images are representative of between 3 and 8 embryos imaged per condition. Graph shows the number of vascular loops present in the CV at 28 hpf. g. Alternatively, vascular morphogenesis of the caudal vein was assessed in pkd2 morphants and cup (pkd2-/-) mutants (cuptc321) at 28 hpf using high-speed imaging of the blood flow. Maximum projections of the acquisitions reveal the anatomy of flow-carrying vessels in the caudal plexus (CA/V=Caudal artery/vein). Asterisks point to vascular loops which are mostly absent in pkd2 morphants and mutants. Graph shows the number of vascular loops present in the CV at 28 hpf. h. Experimental set-up for the stage and region-specific knockdown of pkd2 using a photo-cleavable sense morpholino. i. Images and 3D models of the vasculature at 28 hpf are provided. j. Graph shows the number of vascular loops present in the CV at 28 hpf. k. Flow velocities were measured upon high-speed imaging of blood cells in the caudal artery. Mean and maximum flow velocities were measured at 28 hpf. l. Calcium content in the developing DA was quantified and images are provided. m. Brightfield and fluorescent images of cilia number and localization in Tg(β-actin:arl13b-egfp) injected or not with ift88MO1 are shown. Similar results were obtained in embryos injected with ift88MO3 (not shown). n. Morphology of the caudal vein in control and ift88 morphants at 28 hpf. Asterisks point to vascular loops which are mostly absent in ift88 morphants. Graph shows the number of vascular loops present in the CV at 28 hpf. o. Overall endothelial cell number in the venous caudal plexus of 28 hpf Tg(fli1a:neGFP)y7 embryos and normalized per somite p. Calcium content in the developing DA using the endothelial-specific expression of Gcamp 3.0 in Tg(fli:gal4ff; UAS:gcamp3.0) embryos. q. Mean and maximum flow velocities at 28 hpf in the indicated embryos. r. Experimental set-up for the stage and region specific knockdown of ift88 using a photocleavable sense morpholino. s. Brightfield and fluorescent images of cilia number and localization, and of the vascular morphology (caudal plexus) at 28 hpf. t. Graphs show the number of vascular loops present in the CV (top panel), as well as calcium content in the developing DA after conditional knock-down (bottom panel), at 28 hpf. u. Mean and maximum flow velocities at 28 hpf in the indicated embryos.