
Image
|
Figure Caption
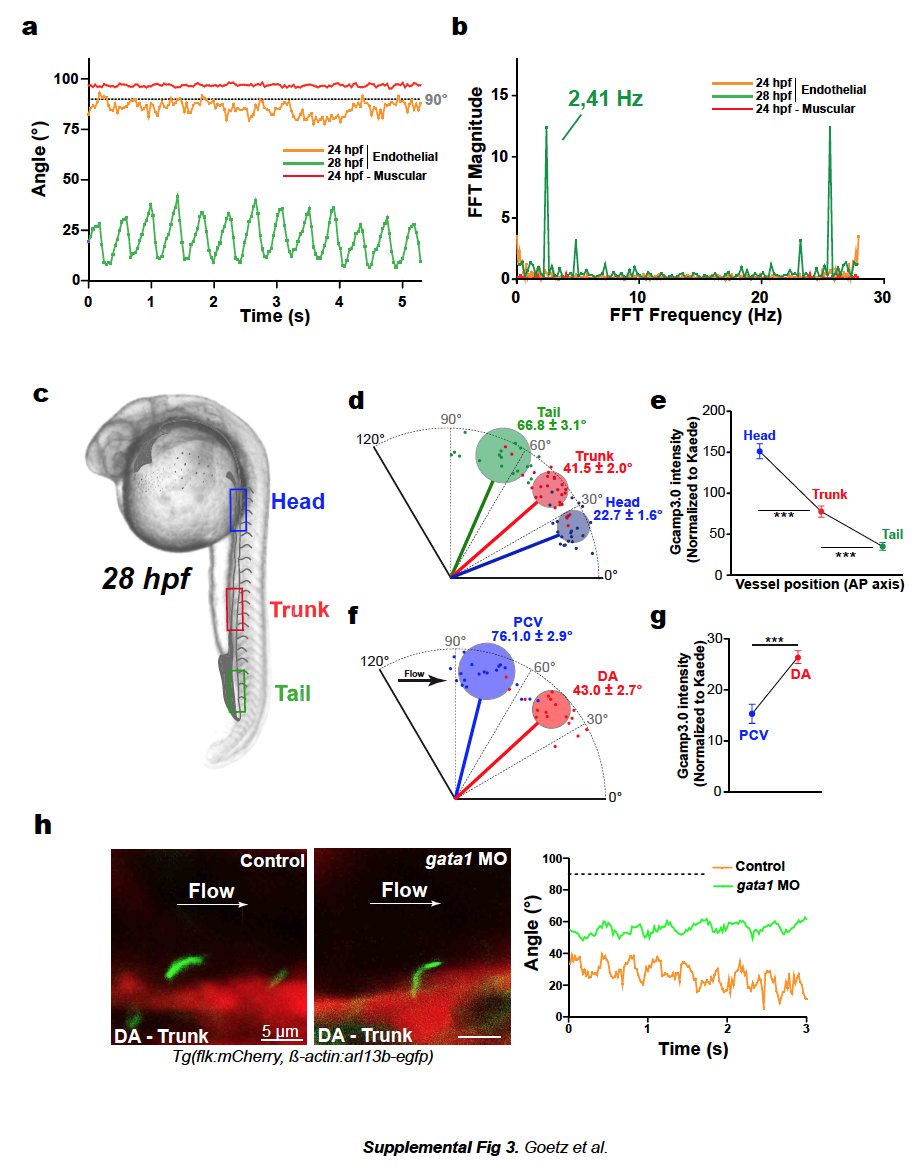
Fig. S3
a. Deflection angles of the indicated cilium were plotted over time. b. Frequency analysis was performed using discrete Fourier transforms of ciliary movement. See also Movie 14. c-g. Cilia deflection and corresponding calcium content in three regions of the DA (d, e) and in the "trunk" region of the DA and PCV (f, g). h. Images and deflection angle analysis of cilia in 28 hpf embryos injected or not with gata1MO. See also Movie 17.
Acknowledgments
This image is the copyrighted work of the attributed author or publisher, and
ZFIN has permission only to display this image to its users.
Additional permissions should be obtained from the applicable author or publisher of the image.
Full text @ Cell Rep.