
|
Fig. S1
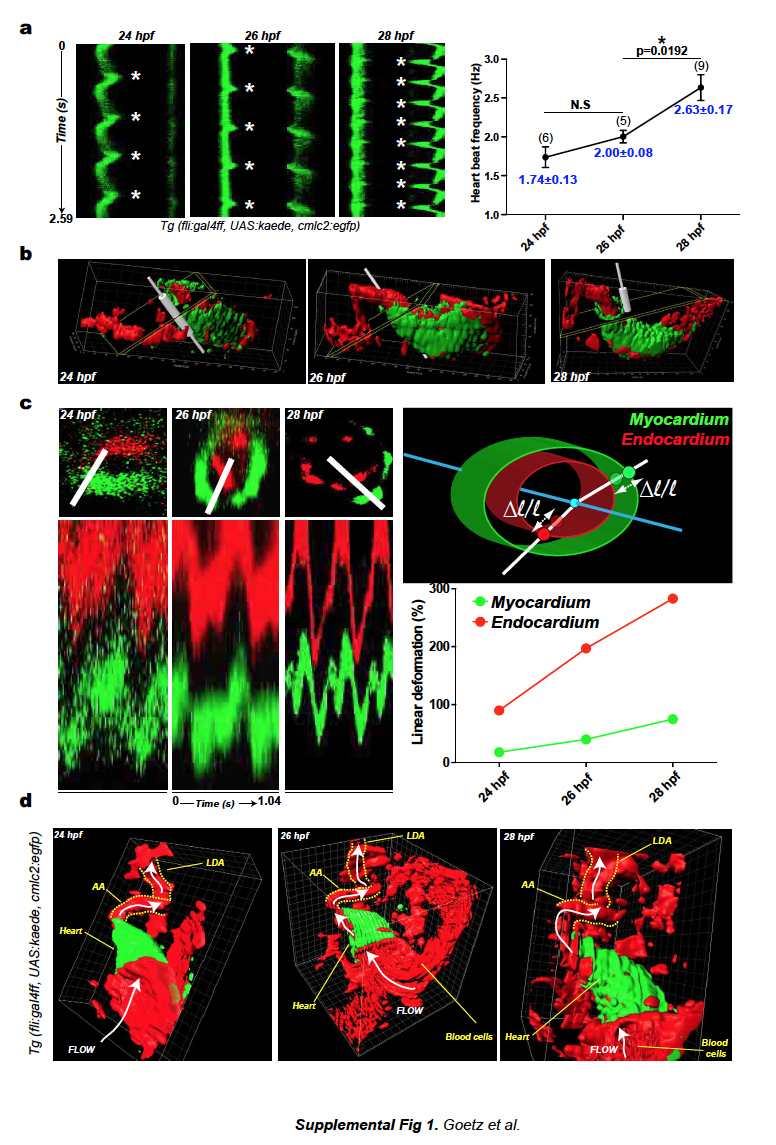
a. Kymographs of a single section (cmlc2:egfp, myocardium) in the developing heart tube are presented (asterisks indicate heart contraction). Graph displays quantification of the heart beat frequency in 24, 26 and 28 hpf embryos. b. 3D representation of beating hearts in Tg(fli:gal4FF; UAS:kaede; cmlc2:egfp) embryos. The heart myocardium is labeled in green (GFP), the endocardium and blood cells are in red (photoconverted kaede). The outflow tract region of the heart was further analyzed. Snapshot presents the axis and plane of section of the slice presented in c. Linear deformation of myocardium and endocardium was studied upon sectioning of the heart in the outflow tract region (b.) A kymograph analysis was performed on the resulting sections (1.04s) and linear deformation was quantified as shown in the scheme. See also Movie 5. d. 3D representation of the cardiac region and its associated vasculature in 24, 26 and 28 hpf Tg(fli:gal4FF; UAS:kaede; cmlc2:egfp) embryos. Heart myocardium is labeled in green (GFP), endocardium and blood cells are in red (photoconverted kaede). White arrows indicate direction of flow. LDA: Lateral Dorsal Aorta, AA: Aortic Arch. See also Movies 1 to 5. e. Flow mapping of the cardiovascular system of a 26 hpf embryo as shown in Fig.1h. Red-labeled blood cells were tracked over time and the tracks were color-coded for their instantaneous, mean and maximum velocity. Quantification is presented in Fig.1i. See also Movie 7.