
|
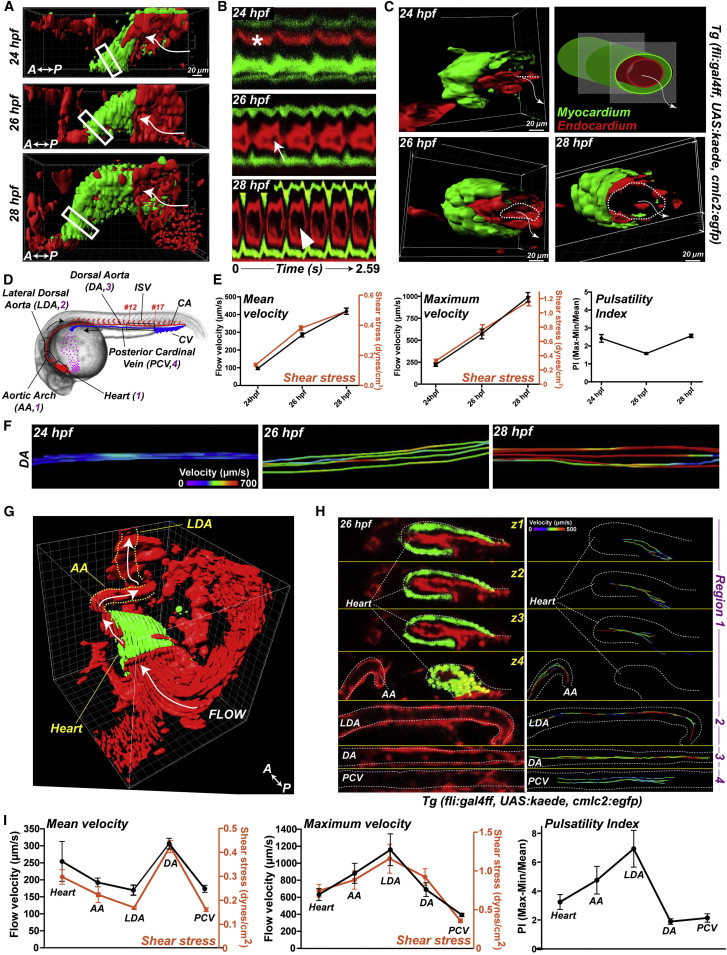
Fig. 1
Early Cardiac Morphometrics and Subsequent Hemodynamics at Blood Flow Onset
(A) 3D imaging of the heartbeat in Tg(fli:gal4FF; UAS:kaede; cmlc2:egfp) embryos. Heart myocardium is labeled in green (GFP), and endocardium and blood cells are in red (photoconverted Kaede).
(B) Kymographs of a section (boxed region) of the heart tube. The asterisk indicates the absence of a visible endocardial lumen at 24 hpf. The arrows indicate the progressive opening of the lumen at 26 and 30 hpf.
(C) 3D sections of the boxed regions in (A). The dashed lines underline the endocardium opening and the arrows show the flow direction.
(D) Simplified view of the cardiovascular system of 24–28 hpf embryos. CA, caudal artery; CV, caudal vein; ISV, intersomitic vessels.
(E) Blood cell tracking in the developing DA (see box in D). Graphs show the mean and maximum flow velocity in the DA (see box in D) and the pulsatility index (PI) at 24, 26, and 28 hpf.
(F) Tracks in the DA are color-coded for their instantaneous velocity over time.
(G) 3D anatomy of a 26 hpf heart and its neighboring vasculature and flow direction. See also Movies S5 and S7.
(H) Vascular hemodynamics in a single embryo. Three sections of the same heart are displayed (see corresponding regions in D). Tracks are color-coded for their instantaneous velocity over time.
(I) Plots of the velocity and PI observed in a single embryo.
Error bars depict SEM. Statistical significance was determined by unpaired Student’s t test; p < 0.05, p < 0.01, p < 0.001.