
|
Fig. 8
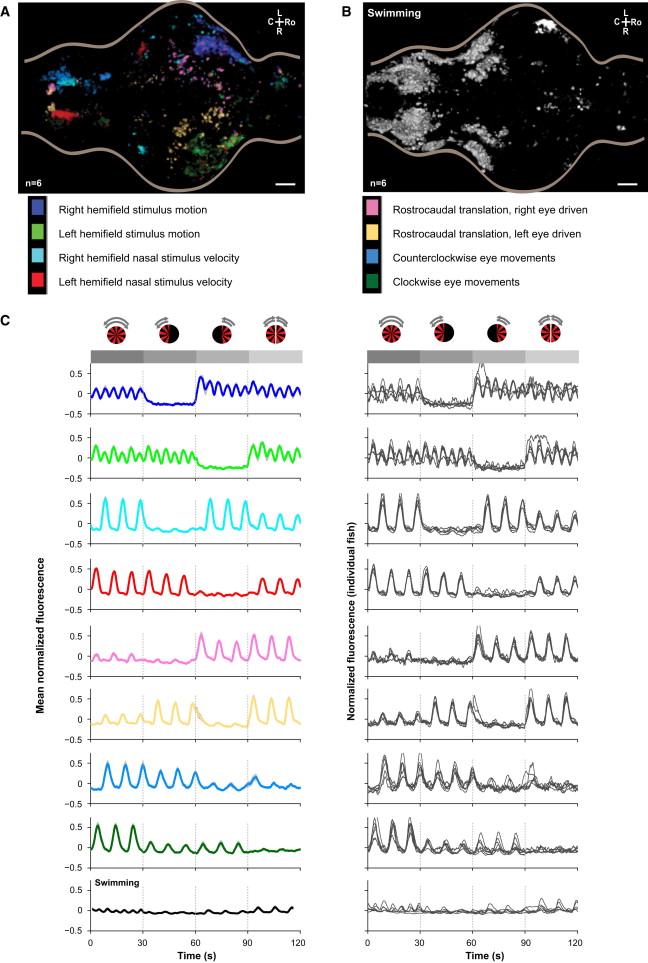
Functional Dissection of Activity Based on Multidimensional Clustering
(A) Rendered dorsal view of the anatomical distribution of four symmetrical functional clusters, averaged over seven fish, from k-means clustering of the behavioral correlation vectors of responsive cubes. See also Figure S8 and Movie S10.
(B) Rendered dorsal view of the combination of five symmetric clusters that show strong correlation with tail movement, averaged over seven fish.
(C) Fluorescence traces for each of the nine cube cluster groups shown in (A) and (B) for individual fish (right) and averaged across the seven fish (left; gray shading represents SEM). A schematic of the four stimuli is shown (see Figure 6 and Figure S1). Gray boxes and dotted lines indicate the duration of each of the four stimuli in all plots.