
|
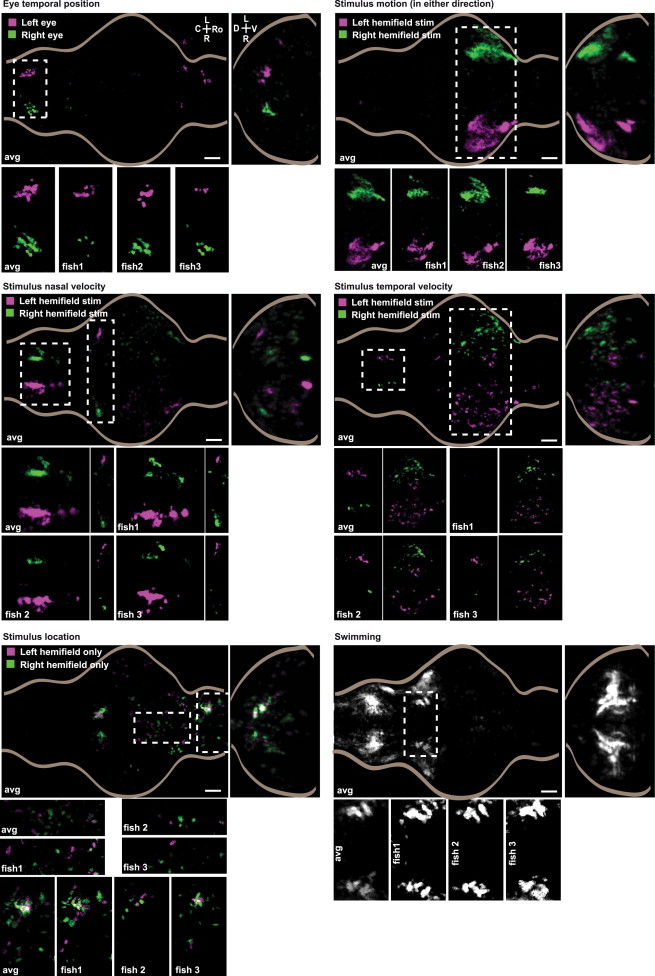
Fig. 7
Consistent Localization of Sensorimotor Signals in the Zebrafish Brain
Distribution of cubes that correlate best with particular sensory and motor variables (r > 0.3) averaged across seven fish. The location of many correlation-defined regions in the maps shows remarkable consistency across fish. For each regressor/regressor pair, a z-sum projection and a coronal sum projection are shown. Coronal sections were smoothed along the z axis with a 1.5 μm Gaussian filter. For each map, an area of interest is highlighted in the whole-brain map and a detailed view of this area is shown for the average map, alongside the identical region, in three example fish. See also Figure S7. Scale bars in all panels, 50 μm.