
|
Fig. 3
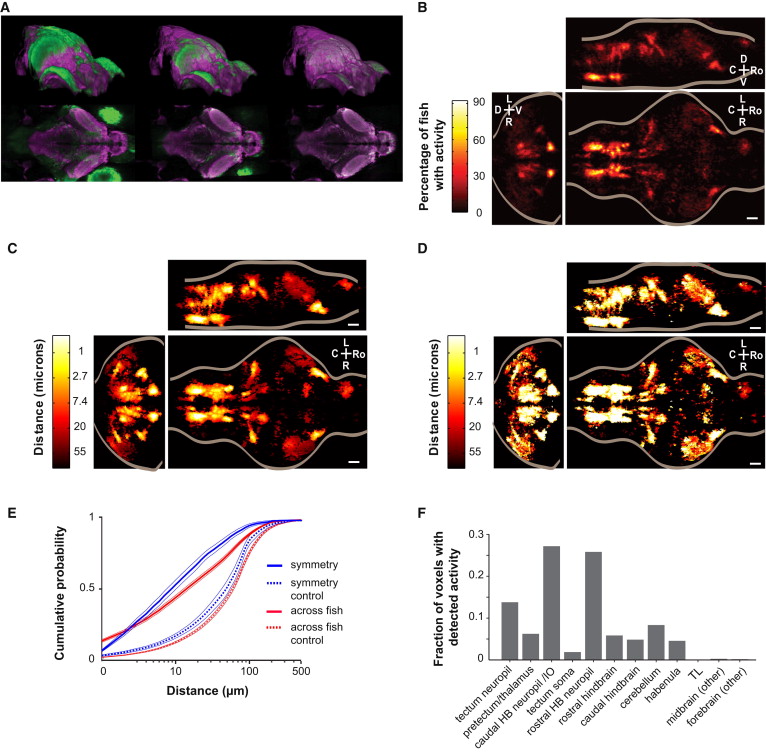
Morphing onto a Reference Brain Reveals Stereotypical Activity
(A) An individual larva brain (green) is morphed in three dimensions onto a reference brain (magenta) by performing an affine followed by a nonrigid alignment.
(B) Maximum projections from three orthogonal views, showing the percentage of fish (n = 13) imaged that show activity at each voxel (after registration) for all voxels within the brain. Scale bars in all panels, 50 μm.
(C) Minimum projections of the median distance that needs to be traveled in every other brain to find a similarly active voxel (see Experimental Procedures). The data are averaged across all comparisons (n = 13 fish, 156 comparisons).
(D) Minimum projections of the median distance that needs to be traveled to find a similarly active voxel in the left/right flipped of the same brain. The data were averaged across all fish (n = 13).
(E) The cumulative probability for finding a similarly active voxel within a given distance for the data in (C) (red) and (D) (blue). The data are averaged across all comparisons (red line, n = 13 fish, 156 comparisons). To control for the overall spatial distribution of ROIs, the same analysis was performed with the phases of the starting ROIs randomly shuffled (dotted lines).
(F) Fraction of detected active voxels by brain region in imaging data averaged across three individual brains from fish that were selected based on similarity of behavioral profile during imaging.