
|
Fig. 1
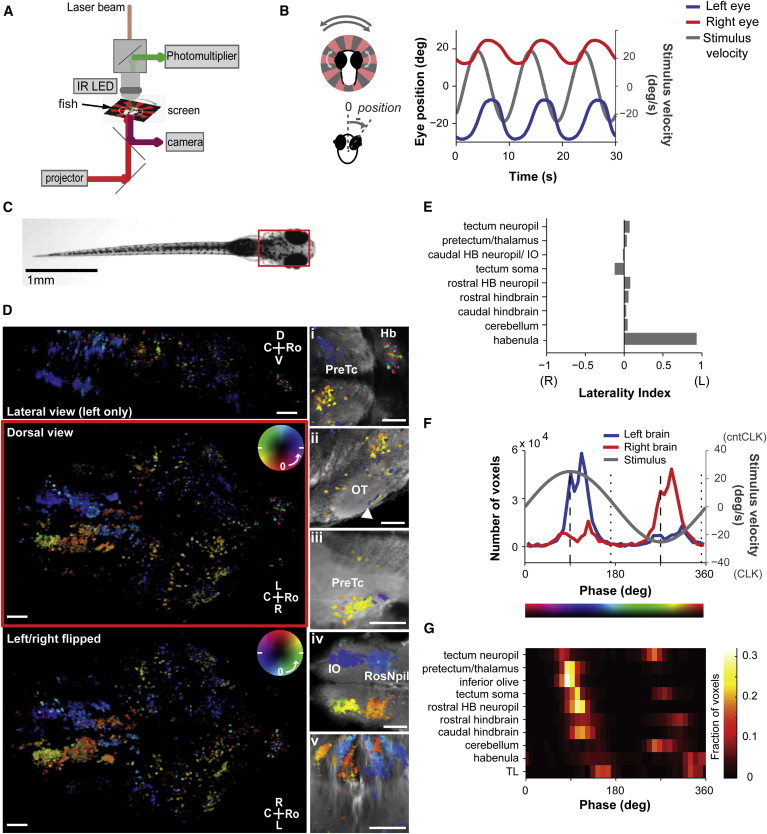
Imaging the Whole Brain of a Single Fish during Visuomotor Behavior
(A) Experimental setup. Zebrafish larvae were restrained in agarose, with their eyes and tail free, and placed on a screen for visual stimulation. Eye and tail movements were tracked while imaging brain activity with a two-photon microscope.
(B) Optokinetic response (OKR). Top left: larvae were presented with a rotating radial striped pattern. Bottom left: eye position was defined as the eye angle relative to the midline. Counterclockwise eye positions were defined to be positive. Right: larvae tracked the movement of the grating with a conjugate movement of the eyes. Stimulus rotation was sinusoidally modulated (gray, stimulus velocity). The mean eye position throughout the recording session is shown. In each imaging plane, the stimulus was presented three times. See also Figure S1 and Movie S1.
(C) Image of a 6-day-old larval zebrafish. Red box indicates the imaged area in (D). Scale bar, 1 mm.
(D) Activity phase maps show that different brain areas are modulated at different phases relative to the stimulus. Center left: rendered dorsal view of all ROIs in one fish, color-coded according to the phase of their response at the stimulus frequency (see Experimental Procedures and Figure S2); white marks in the color wheel show the peaks of stimulus velocity. Top left: lateral view of ROIs in the left half of the brain. Bottom left: dorsal view that has been left/right flipped, and the color map phase-shifted by 180 degrees, to illustrate the symmetry of responses in most brain regions. Right insets show zoomed-in views of ROIs overlaid on the average GCaMP5G fluorescence as an anatomical reference. (i)–(iv) are dorsal views, and (v) is a coronal view. (i) Habenula (Hb) and pretectum (PreTc). (ii) Cell somas in the optic tectum (OT) and layered responses in the neuropil (arrowhead). (iii) Pretectal retinal ganglion cell arborization areas. (iv) Inferior olive (IO) and rostral neuropil (RosNpil) in the hindbrain. (v) Cell columns in the hindbrain. Scale bars, 50 μm. See also Movie S3.
(E) Laterality index for different brain areas. The habenula showed marked asymmetry, with most activity occurring on the left side. HB, hindbrain; TL, torus longitudinalis.
(F) Distribution of phases of activation for voxels located in the left (blue) and right (red) halves of the brain. Phases are corrected to account for the delay introduced by GCaMP5G. Bottom color bar shows the correspondence between phase and map color.
(G) Timing of activation across brain areas. Normalized histogram of the phases of peak activity for different brain areas. Left and right areas have been pooled with a 180° phase shift. Phases are corrected as in (F).