
Image
|
Figure Caption
Fig. S2
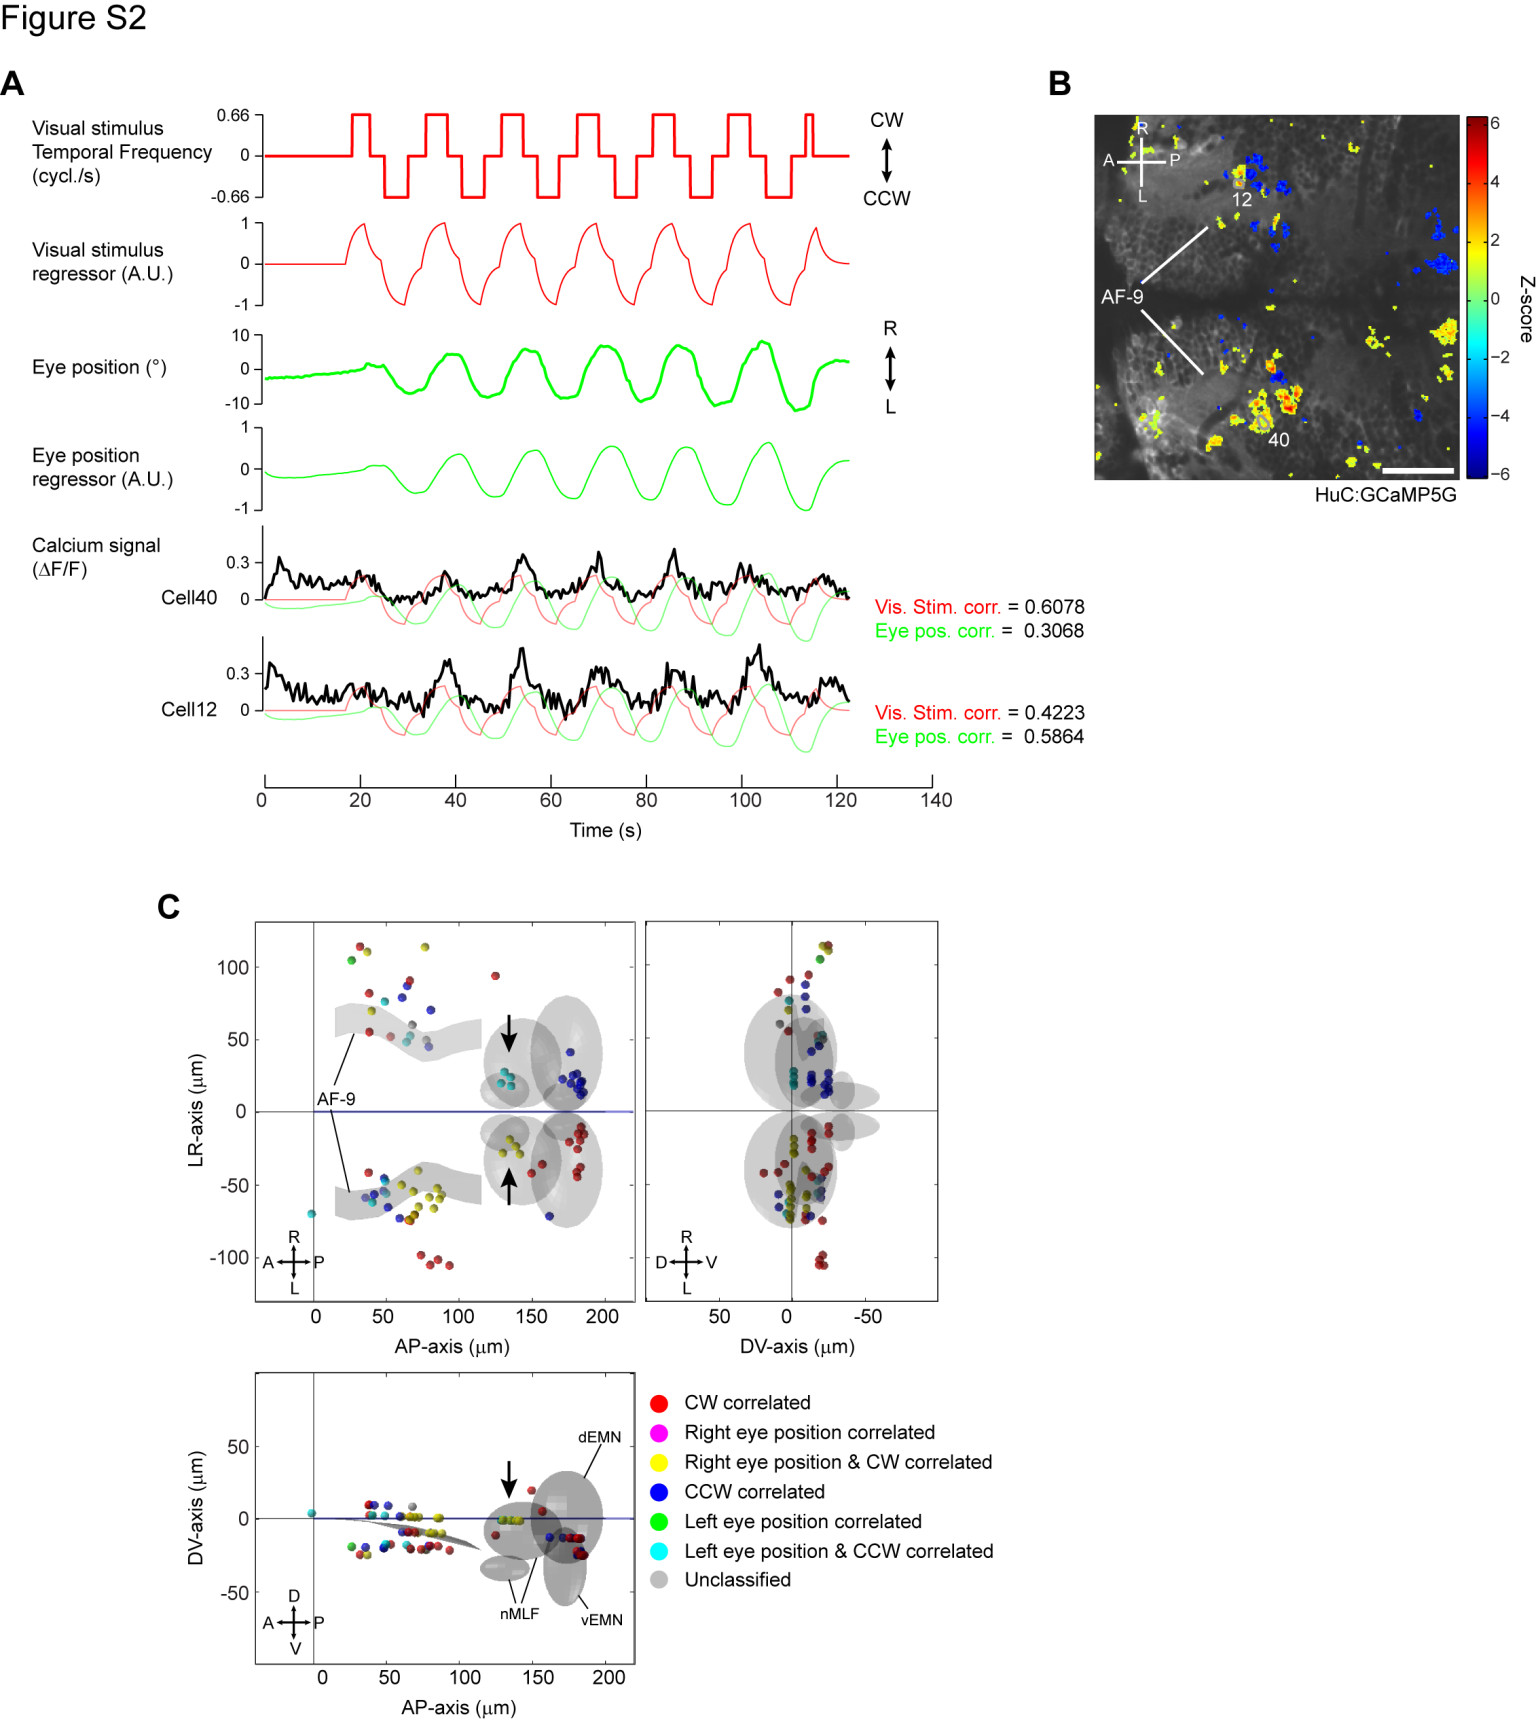
GCaMP imaging with simultaneous eye tracking in a non-paralyzed preparation (related to Figure 2).
(A) Visual stimulation protocol and simultaneous eye movements trace during calcium imaging. The fish was presented with a moving grating while the eye movements were simultaneously recorded using a CCD camera. Convolved regressors are shown below the visual stimulus and eye position trace, respectively. Constant temporal frequency at 1 (or 0.66) cycle/s was used to avoid motion artifacts resulting from vigorous eye movements. Two example fluorescence (μF/F) traces are shown at the bottom, overlaid with the visual stimulus regressor (red) and eye position regressor (green). Correlation coefficients to the two regressors are shown on the right. (B) 2D map of visual stimulus correlated cells revealed in HuC: GCaMP5G fish. Visual stimulus regressor in (A) was used as a main regressor for pixel/cell identification. Pseudocolor scale shows the correlation to the visual stimulus regressor (Z-score). The cell numbers correspond to the calcium traces shown in (A). A, anterior; P, posterior; R, right; L, left; AF9, neuropils containing the retinal ganglion cell arborization field AF9. (C) 3D-reconstruction of visual stimulus and eye position correlated cells. Cells were identified using the visual stimulus regressor (main regressor) and subsequently classified based on the correlation coefficients to the visual stimulus regressor and the eye position regressor using a threshold of 0.4. Most cells we identified were correlated only with the visual stimulus (red and blue) or with both the visual stimulus and eye position (yellow and cyan) and only one purely eye position correlated cell was found. Correlated cells are scarcer and less clustered compared to the paralyzed condition, probably due to the fewer repetitions of the visual stimulus and/or the suboptimal temporal frequency. Nonetheless, AMC and PDC are detected. Arrows indicate clusters of cells with both eye position and stimulus correlations in the proximity of nMLF at AP-axisH 130 μm, LR-axis H ± 25 μm, DV-axis H 0 μm. Cells in this domain were not detected in the paralyzed conditions (see Figure 2E), suggesting that they require intact eye movements to achieve their responses. Scale bar: 50 μm.
Acknowledgments
This image is the copyrighted work of the attributed author or publisher, and
ZFIN has permission only to display this image to its users.
Additional permissions should be obtained from the applicable author or publisher of the image.
Full text @ Neuron