
|
Fig. 3
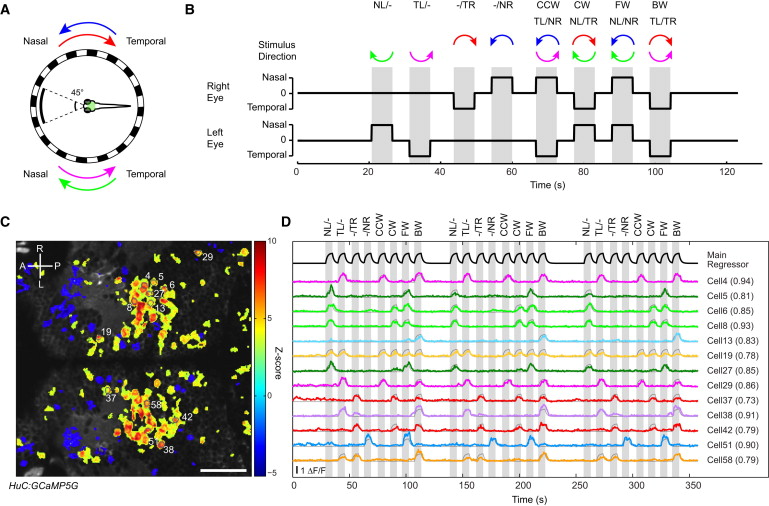
Calcium Imaging of HuC:GCaMP5G Fish in Response to Monocular and Binocular Stimulation
(A) Schematic diagram of the experimental setup. The fish’s central visual field (45°) was masked to avoid stimulation of the binocular visual field. The green box shows the approximate region imaged in (C). Each half of the LED arena was rotated in nasalward (N) or temporalward (T) direction.
(B) Visual stimulation protocol. NL/ indicates nasalward motion to left eye; TL/ indicates temporalward motion to left eye; /TR indicates temporalward motion to right eye; /NR indicates nasalward motion to right eye; CCW indicates counter-clockwise; CW indicates clockwise; FW indicates forward; BW indicates backward.
(C) Z score map of an example recording showing motion-correlated pixels colored in red/yellow. The main regressor used for analysis is shown in the top row of (D). A indicates anterior; P indicates posterior; R indicates right; L indicates left.
(D) Example fluorescence (ΔF/F) traces (colored lines) from the single recording in (C). The eight different stimulus phases (shown in gray vertical bars) were repeated three times in one recording. Cell numbers correspond to the labels in (C). The best-performing regressor traces (gray lines, see Results) are overlaid on ΔF/F traces. Correlation coefficients with the corresponding regressors are given in parentheses. Scale bar shows 50 μm.