
|
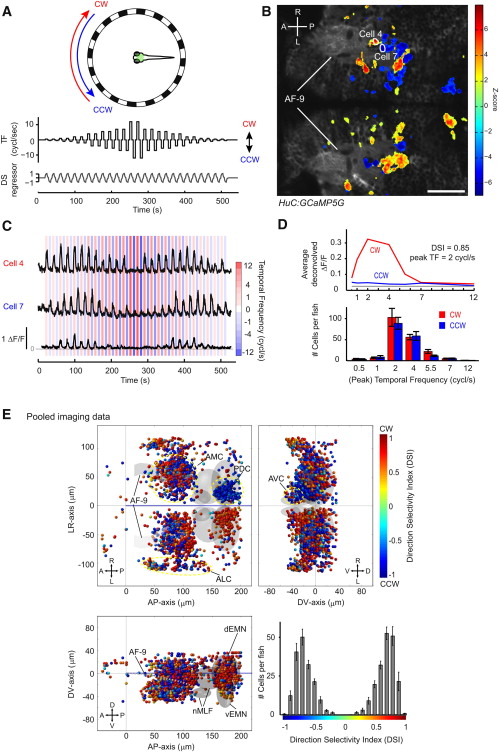
Fig. 2
Calcium Imaging of the Pretectum Reveals High Degree of Direction Selectivity during Whole-Field Motion
(A) Illustration of the stimulus protocol for two-photon calcium imaging during simultaneous visual stimulation. (Top) An LED arena surrounding the fish was used for visual stimulation. The green box shows the approximate region imaged in (B). (Middle) Stimulus directions were alternated (CW or CCW) and had varying temporal frequencies (TF, 0.5–12 cycles/s). (Bottom) A direction-selective (DS) regressor was built from the stimulus protocol.
(B) 2D map of image pixels that are correlated with the DS regressor, superimposed on an optical section of the HuC:GCaMP5G transgenic animal. Pseudocolor scale shows the local correlation to the DS regressor (Z score, see Experimental Procedures for details). A: anterior; P: posterior; R: right; L: left.
(C) Fluorescence (ΔF/F) traces during the visual stimulus presentation. The cell numbers correspond to the ones in (B). Cell 4 responded during CW rotation, whereas cell 7 responded during CCW rotation. Both cells responded to temporal frequencies ranging from 0.5 to 7 cycles/s and less so to 12 cycles/s.
(D) (Top) Tuning curve of the cell plotted at the bottom of (C) during the CW (red) and CCW (blue) stimulations. The gray line indicates the threshold used for DSI calculation (see Experimental Procedures). (Bottom) Histogram showing the distribution of peak temporal frequencies per fish (n = 7 fish).
(E) 3D reconstructed map of CW- and CCW-responsive cells. Each dot represents a cell and is color-coded according to its direction selectivity index (DSI). Coordinates are defined as distances relative to the anterior-dorsal edge of neuropils in the diencephalon (anterior-posterior axis and dorso-ventral axis) and midline (left-right axis). dEMN indicates dorsal extraocular motor neurons; vEMN indicates ventral extraocular motor neurons; together, dEMN and vEMN correspond to the trochlear and oculomotor nuclei; nMLF indicates nucleus of the medial longitudinal fasciculus. Cells cluster in four anatomical regions (see Results): AMC, ALC, AVC, and PDC. (Lower right) Histogram of DSIs per fish (n = 7 fish). Error bars indicate SEM. Scale bar shows 50 μm. See also Figures S1–S4.