
|
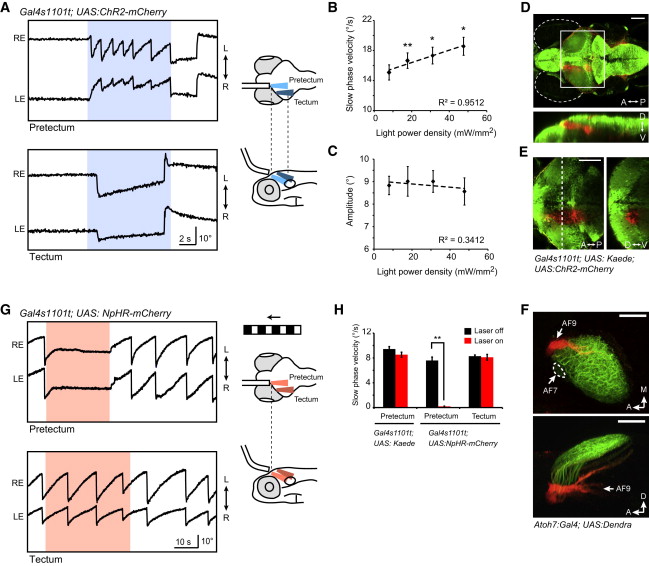
Fig. 1
Optogenetic Manipulations of the Pretectal Area during OKR
(A) Angular eye position during ChR2 stimulation in the pretectal (top) and tectal (bottom) area. Blue-shaded regions depict the epoch of ChR2 stimulation (power density = <18 mW/mm2). Schematics of optical stimulation are shown on the right. An optic fiber (diameter 50 μm) was positioned in parallel to the fish’s longitudinal axis and angled ventrally. For tectum stimulation, the optic fiber was shifted laterally and posteriorly compared to the pretectum stimulation. LE indicates left eye; RE indicates right eye.
(B and C) Velocity and amplitude of slow-phase eye movements evoked by ChR2 stimulation as a function of laser power density. Right and left stimulations were pooled, and the eye contralateral to the stimulated side was measured (n = 6 fish). p < 0.01; p < 0.05; paired t test against the lowest laser power density. R2 indicates square of Pearson’s correlation coefficient.
(D) Confocal z projection of a Gal4s1101t; UAS:ChR2-mCherry; UAS:Kaede fish in dorsal view (top) and side view (bottom). Kaede was locally photoconverted (red) in the left pretectum.
(E) Single optical section (3.6 μm) of the photoconverted area; corresponding to the white box in (D) in dorsal view (left). A frontal view at the level of dashed line is shown on the right.
(F) Photoconversion of RGC axons. Confocal z projection of an Atoh7:Gal4; UAS:Dendra larva after photoconversion using a 50 μm optic fiber in dorsal view (top panel) and side view (bottom panel). Photoconverted Dendra (red) was detected in AF9 and the deepest layer of the tectum (which receives projections from RGCs that project to AF9), whereas AF7 and most of the tectum (AF10) remained unconverted (green).
(G) Representative eye traces of an NpHR-stimulated animal during OKR. Red-shaded regions indicate the epoch of NpHR stimulation (633 nm; <140 mW/mm2). Schematics of visual and optical stimulations are shown on the right.
(H) Slow-phase velocity of the OKR under laser off and on conditions (n e 6 fish for each condition). The eye contralateral to the NpHR-stimulated side was measured. p = 0.00064, paired t test. A indicates anterior; P indicates posterior; D indicates dorsal; V indicates ventral; M indicates medial. Error bars indicate SEM. Scale bars show 100 μm (D–F).