
|
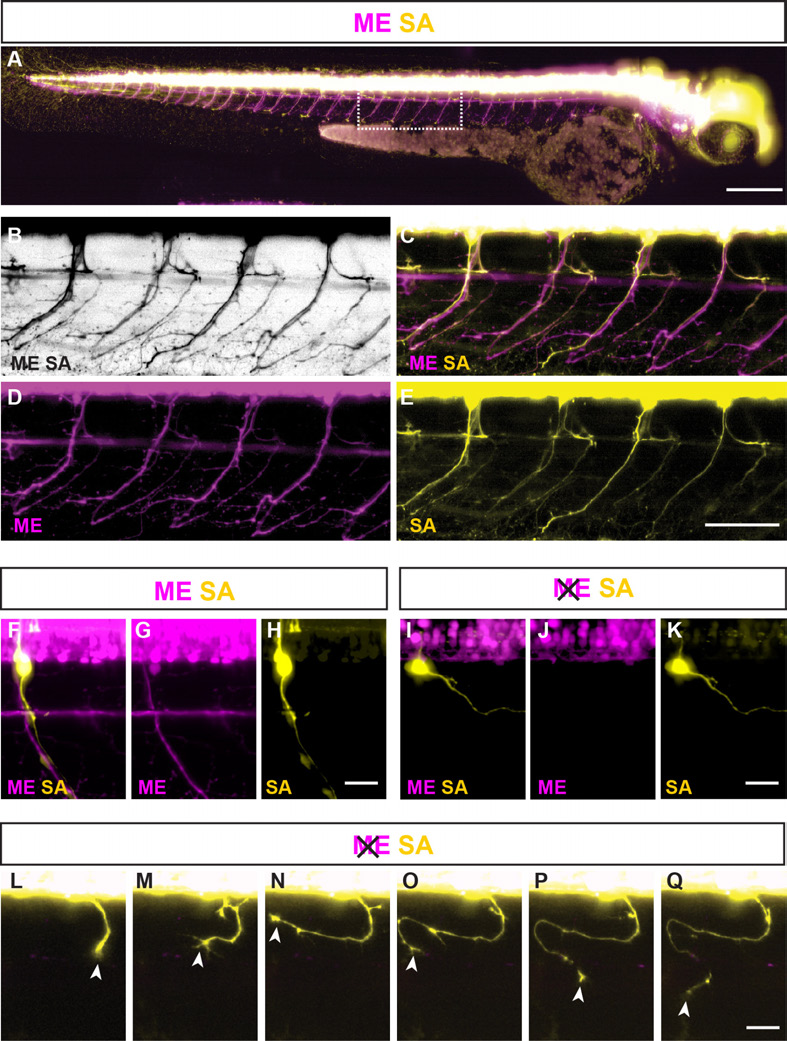
Fig. S1 Visualizing and manipulating peripheral MEs and SAs in zebrafish. (A) Lateral wholemount view of peripheral MEs (magenta: TgNBT:dsRed) and SAs (yellow: Tg- 8.4neurog1:GFP) in 72 hpf zebrafish larva. (B-E) Detailed view of trunk PN segments. (B) Monochromatic rendering of all axons. (C) Overlay of ME and SA signals. (D) Separate visualization of MEs. (E) Separate visualization of SAs. (F-H) Example: control SAs and MEs extending from dorsal root ganglion (DRG) neuron and neural tube, respectively. (I-K) Example: aberrant SA extension at segment lacking MEs upon motor neuron ablation by islet1E2/3-MO injection. (L-Q) Time-lapse sequence of highly aberrant SA extension in the absence of MEs. Scale bars: 300 µm in A; 50 µm in E; 20 µm in H,K,Q.