
|
Fig. 5
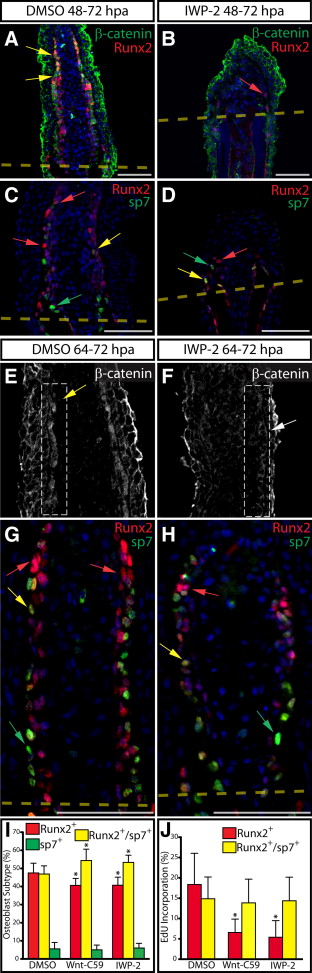
Wnt Is Required for Maintenance of Runx2+ Preosteoblasts during Fin Regeneration
(A–D) Runx2 (A–D, red), β-catenin (A and B, green), and sp7 (C and D, green) protein expression on sections from DMSO (A and C) and IWP-2-treated (B and D, 10 μM from 48 to 72 hpa) fish. In (A) and (B), yellow arrows indicate Runx2+ cells with nuclear-localized β-catenin and the red arrow points to a Runx2+ cell lacking nuclear β-catenin. In (C) and (D), red arrows show Runx2+ cells, yellow arrows point to Runx2+/sp7+ cells, and green arrows mark sp7+ cells.
(E and F) β-catenin localization at 72 hpa in DMSO (E) and IWP-2-treated fish (F, 10 μM at 64–72 hpa). The osteoblast-populated domain of the blastema is bounded by a dashed white box, and the white arrows point to osteoblasts with β-catenin expression.
(G and H) Runx2 (red) and sp7 (green) levels in DMSO (G) and IWP-2-treated fins (H, 10 μM at 64–72 hpa) harvested 72 hpa. Red, yellow, and green arrows indicate Runx2+, Runx2+/sp7+, and sp7+ cells, respectively. Nuclei are in blue. Scale bars represent 50 μm.
(I) Osteoblast subtype percentile representation on matched fin sections (n > 6 rays collected from three animals and representing >600 osteoblasts for each treatment) harvested 72 hpa following DMSO (64–72 hpa), Wnt-C59 (100 nM, 64–72 hpa), or IWP-2 (10 μM, 64–72 hpa) exposure. Asterisks indicate significant differences relative to DMSO-treated fish (all p < 0.02, one-tailed Student’s t tests).
(J) Percentage of Runx2+ and Runx2+/sp7+ osteoblasts in the same sections scored in (I) that had incorporated EdU. Asterisks indicate a significant decrease (p < 0.003, one tailed Student’s t tests).