
|
Fig. 1
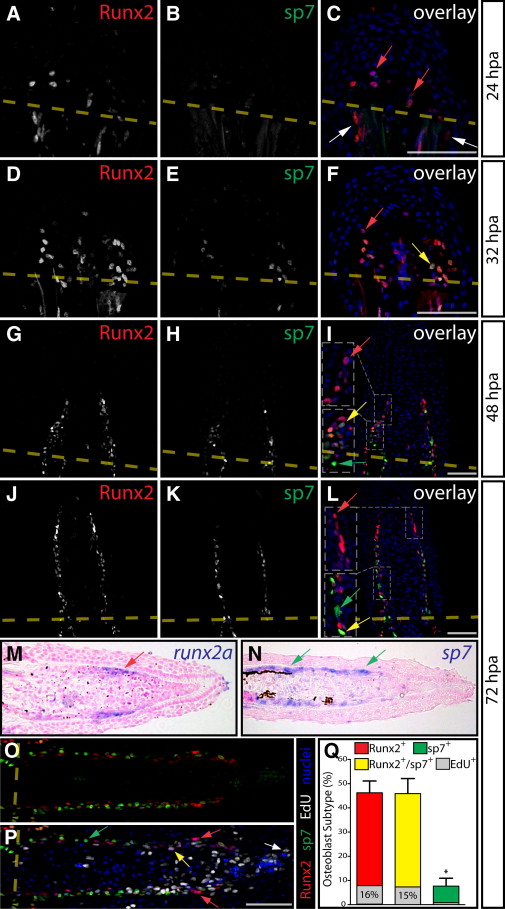
Runx2 and sp7 Define Distinct Populations of Preosteoblasts in Regenerating Fins
(A–L) Runx2 (red) and sp7 (green) immunostaining at 24 (A–C), 32 (D–F), 48 (G–I), and 72 (J–L) hr postamputation (hpa) on longitudinal caudal fin sections. Images are maximum intensity projections of confocal z-stacks. Amputation planes are indicated with a dashed yellow line, white arrows point to Runx2+ cells proximal to the amputation site, red arrows indicate Runx2+ cells distal to the amputation site, yellow arrows denote Runx2+/sp7+cells, and green arrows show sp7+ cells. For (I) and (L), regions bound by dashed white boxes are shown in higher magnification in inset panels.
(M and N) RNA in situ hybridizations showing runx2a and sp7 expression on fin sections harvested 72 hpa. Red and green arrows point to lateral blastema cells expressing runx2a and sp7, respectively.
(O and P) Immunostaining showing Runx2 (red) and sp7 (green) expression (O) and incorporation of EdU (P, white, 6 hr pulse) on 72 hpa fin sections. The white arrow points to an extreme distally located EdU+ blastema cell. The yellow and green arrows indicate Runx2+/EdU+ and sp7+/EdU cells, respectively. Red arrows show high Runx2+/EdU cells. In all overlay images, Hoechst-stained nuclei are shown in blue. The scale bars represent 50 μm.
(Q) Quantitation of osteoblast subtypes and EdU incorporation at 72 hpa. Bars show the mean percentile representation of osteoblast subtypes on comparable sections (n = 12 rays, compiled from >4 fish). Error bars are one SD from the mean, and significant p values are indicated with an asterisk (p < 105, Student’s t tests comparing either Runx2+ or Runx2+/sp7+ populations to sp7+ cells). The proportion of each cell population that incorporated EdU is indicated by the extent of gray shading relative to the bar’s height. Fewer sp7+ relative to Runx2+ cells incorporated EdU (p < 0.03, one-tailed Fisher’s exact test, n = 547 Runx2+ and 75 sp7+ cells).