
|
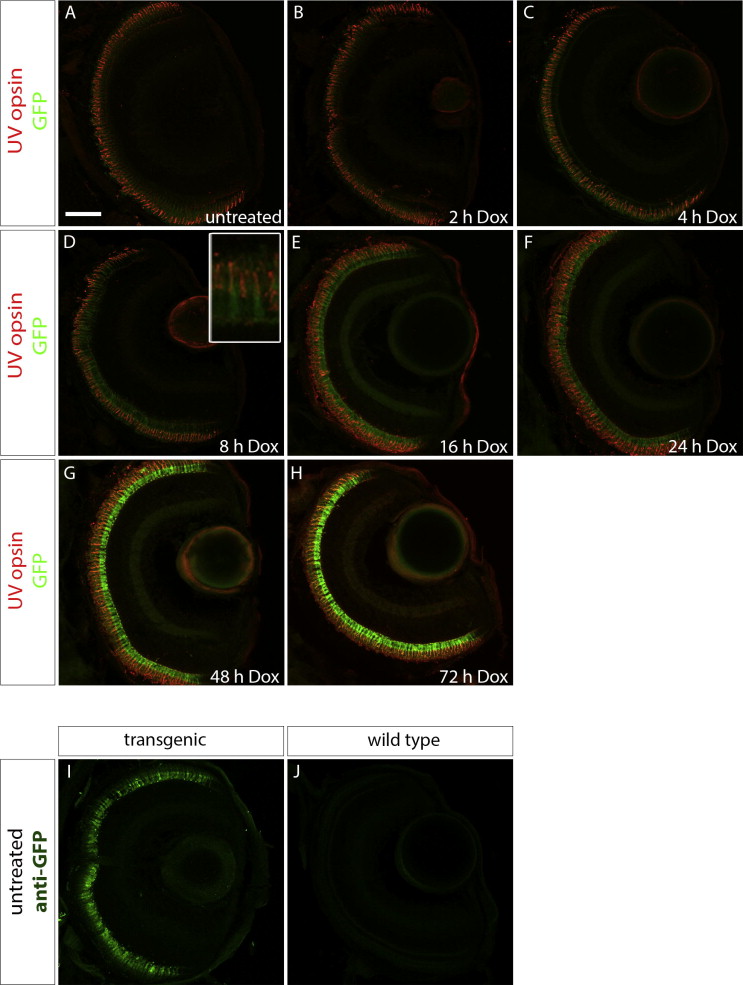
Fig. 2
Time course of doxycycline-induced GFP expression in Tg(opn1sw1:rtTA, TRE:GFP); alb/ larvae. Confocal z-projections of retinal sections from 6 dpf Tg(opn1sw1:rtTA, TRE:GFP); alb/ larvae that were (A) untreated or treated with 10 μg/mL Dox for (B) 2, (C) 4, (D) 8, (E) 16, (F) 24, (G) 48, or (H) 72 h. (A–H) Anti-UV opsin immunofluorescence (red) labels UV cone outer segments. GFP fluorescence (green) is apparent after 8 h of treatment (D, D inset) and continues to increase by number of cones with the increase in Dox exposure time (E–H). (I) Anti-GFP immunofluorescence (green) in untreated transgenic larvae indicates GFP expression that is not present in untreated, wild type larvae (J). Scale bar (A), 50 μm.
Reprinted from Gene expression patterns : GEP, 14(2), West, M.C., Campbell, L.J., Willoughby, J.J., and Jensen, A.M., Two types of transgenic lines for doxycycline-inducible, cell-specific gene expression in zebrafish ultraviolet cone photoreceptors, 96-104, Copyright (2014) with permission from Elsevier. Full text @ Gene Expr. Patterns