
|
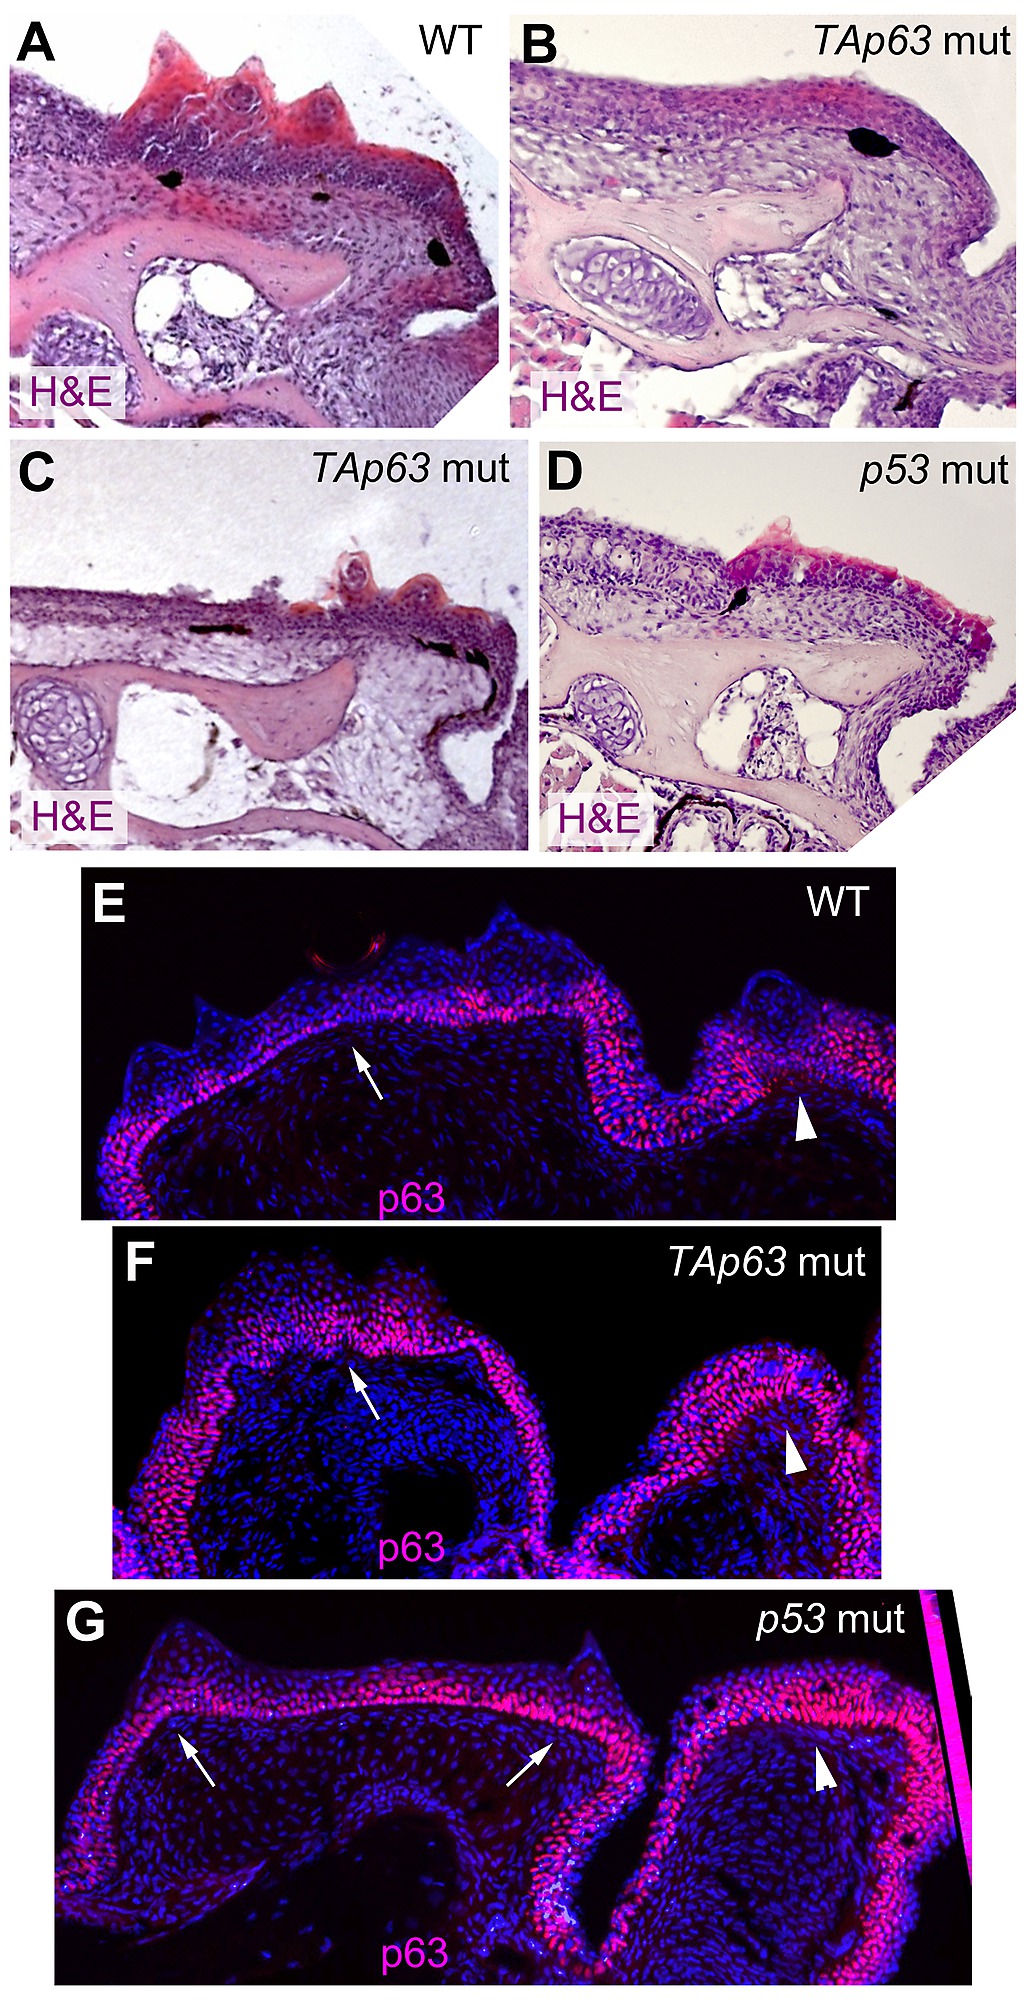
Fig. S4
Overview images of H&E staining and p63 immunofluorescence in TAp63 and p53 mutant and wild-type sibling zebrafish. (A–D) Hematoxylin & eosin staining; transverse sections through breeding tubercle disc region of lower jaw of wild-type (A), TAp63 mutant (B; strong phenotype; C2), TAp63 mutant (C; intermediate phenotype; C1) and p53 mutant (I; intermediate phenotype; C1) at 1 year. For higher magnifications of breeding tubercle regions of panels (A,B,D), see Figure 7G–I. (E–G) anti-p63 immunofluorescence; transverse sections through lower jaw of wild-type (E), TAp63 mutant (F) and p53 mutant (G); 1 year of age. Breeding tubercle disc region is indicated by arrow, breeding tubercle row region by arrowhead. Note that both mutants lack breeding tubercles in the row region, which consists of multiple p63-positive layers. For higher magnifications of disc-shaped breeding tubercle regions of panels (E,F), see Figure 7A,B.