
|
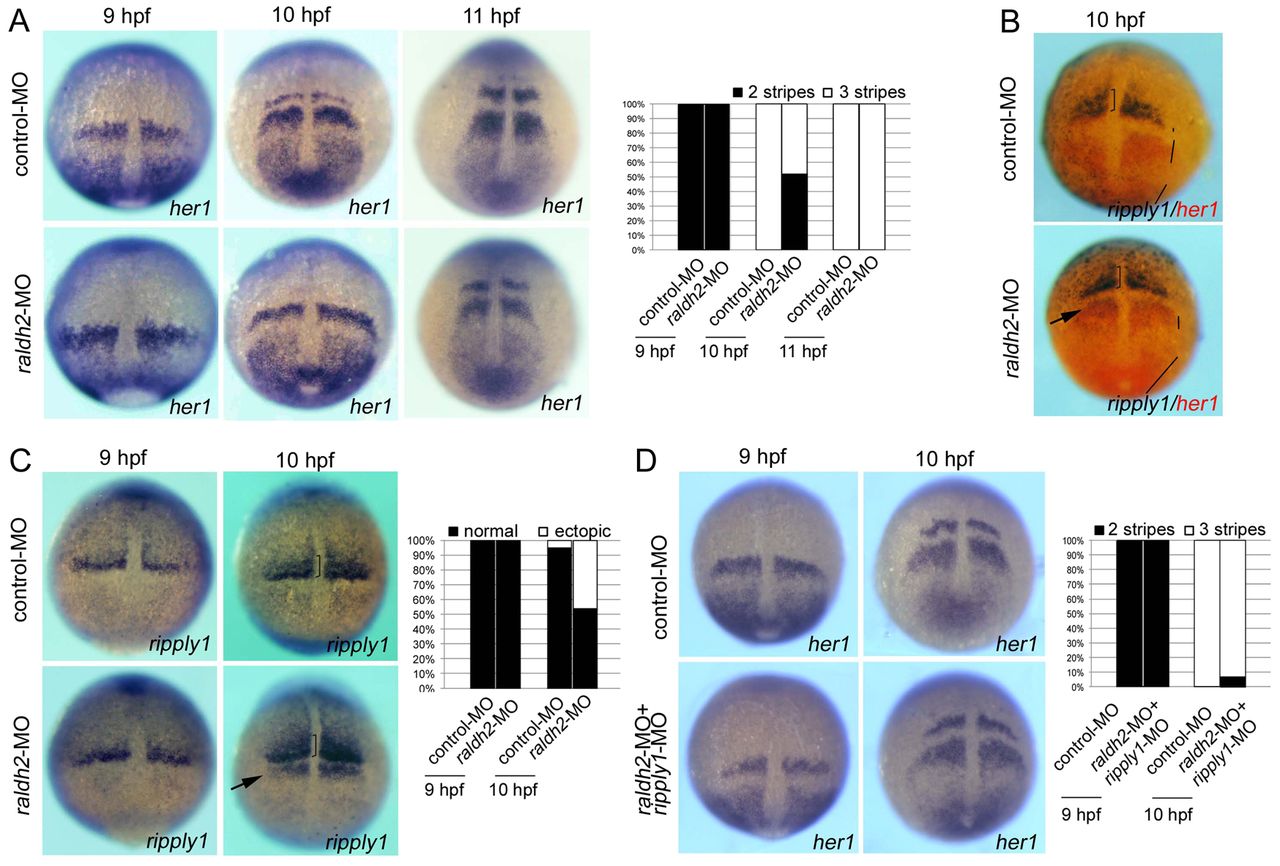
Fig. 4 Relationship between her1 and ripply1 expression during gastrulation. (A) Representative images of her1 expression in control MO- (upper panel; n=33, 37 and 26) and raldh2 MO-injected embryos at 9, 10 and 11 hpf (lower panel; n=35, 29 and 21). Dorsal view, anterior to the top. The increase in stripe number for her1 expression in control embryos is delayed in raldh2 morphants (right graph). A statistically significant difference could be seen between embryos injected with control MO and raldh2 MO (P<0.05, P=0.29×10⁻⁶). (B) Double staining of her1 (red) and ripply1 (purple) in control MO- (upper panel) and raldh2 MO-injected (lower panel) embryos at 10 hpf. (C) Representative images of ripply1 expression in control MO- (upper panel) and raldh2 MO-injected (lower panel) embryos at 9 and 10 hpf. Ectopic expression of ripply1 could be observed in raldh2 morphants at 10 hpf (arrow) (P<0.05, P=0.50×10⁻⁷; right graph). (D) Representative images of her1 expression in control MO- (upper panel; n=58 and 52) and raldh2 MO + ripply1 MO-injected (lower panel; n=63, and 59) embryos at 9, 10 and 11 hpf. Dorsal view, anterior to the top. Decreased number of the her1 stripe in raldh2 morphants could be restored by co-injection of ripply1 MO (right graph). A statistically significant difference was observed in embryos (10 hpf) injected with raldh2 MO versus embryos (10 hpf) injected with raldh2 MO + ripply1 MO (P<0.05, P=0.42×10⁻⁵), but not in embryos (10 hpf) injected with control MO versus embryos (10 hpf) injected with raldh2- MO + ripply1 MO (P>0.05, P=0.12).