
|
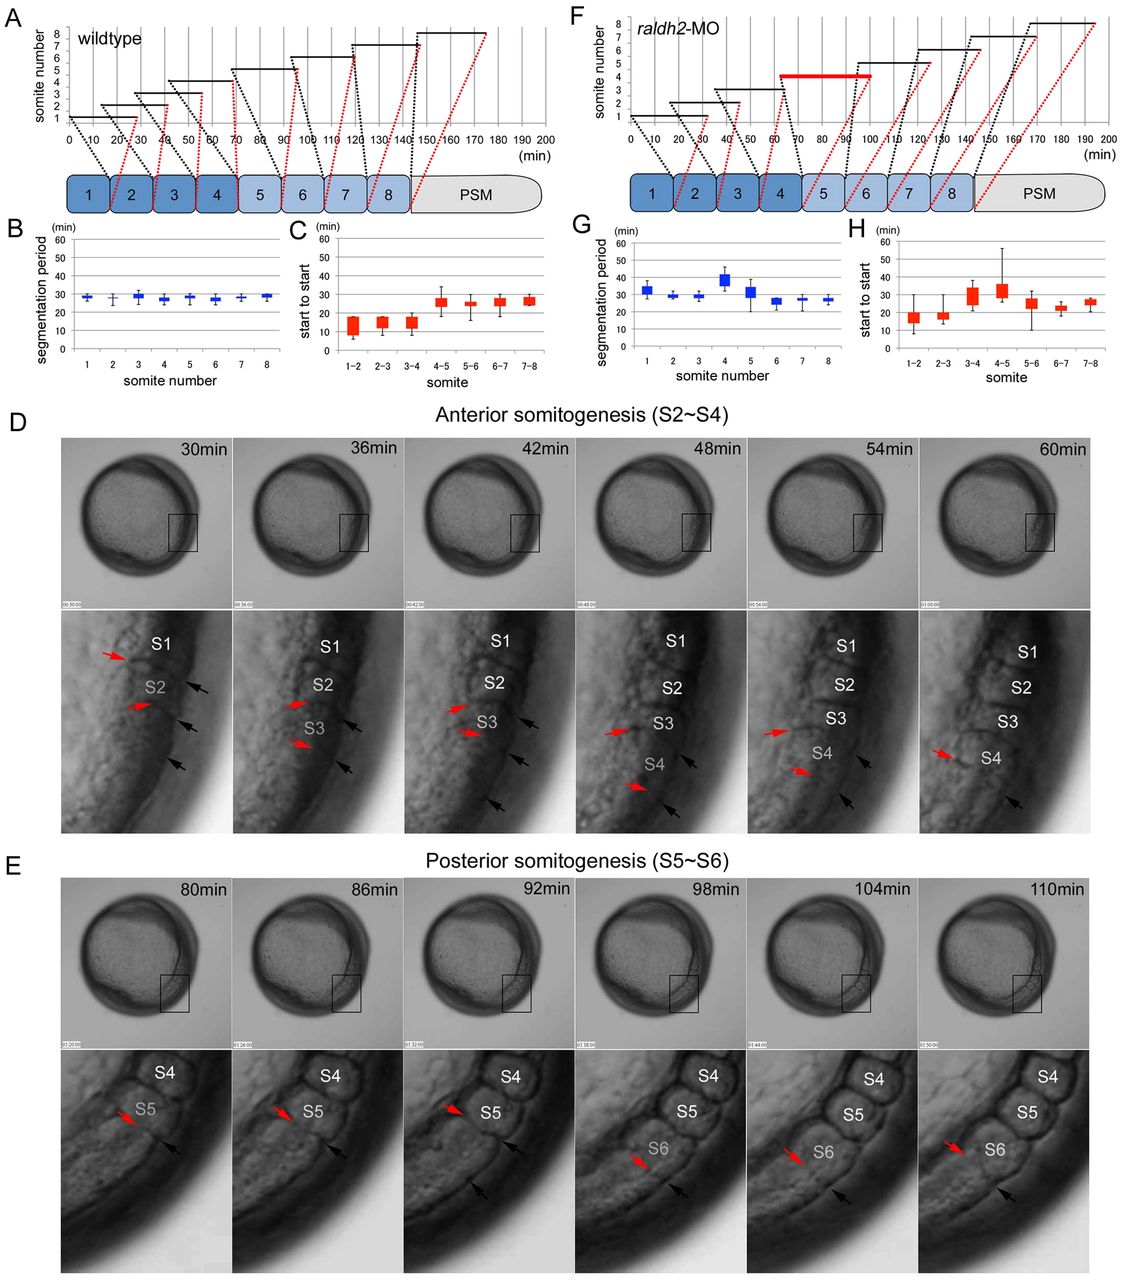
Fig. 1 Knockdown of raldh2 results in a failure of AP transition. (A) Time-lapse data for somitogenesis in a wild-type zebrafish embryo (supplementary material Movie 1A,B). Black bars indicate periods between segmentation start and end. Successive segmentations overlap in somites 1-4. (B) Segmentation periods in wild-type embryos are constant. Segmentation periods (black bars in A) are extracted from wild-type embryos (n=9) and shown as box and whisker plots (minimum, 25% percentile, 75% percentile, and maximum). (C) Overlapping rates of segmentations differ between anterior somites 1-4 and posterior somites 5-8. Box and whisker plots of ‘start to start’, the interval between segmentation starts for one somite and the next, in wild-type embryos (n=9). (D) Typical images for anterior somitogenesis. Time-lapse images from 30 minutes to 60 minutes (6-minute intervals) in the wild-type zebrafish embryo (A) are displayed. Lower panel: higher-magnification views of boxed areas. Black arrows indicate the dorsal limit of the furrow of forming somite. Red arrows indicate the ventral limit of the furrow. Segmentations overlap in somites 2-4 (S2-S4). (E) Typical images for posterior somitogenesis. Time-lapse images from 80 minutes to 110 minutes (6-minute intervals) in the wild-type zebrafish embryo (A) are displayed. Lower panel: higher-magnification views of boxed areas. Black arrows indicate the dorsal limit of the furrow of newly formed somite. Red arrows indicate the ventral limit of the furrow. Segmentations in somites 5 and 6 (S5 and S6) occur sequentially. (F) Time-lapse data for somitogenesis in a raldh2 MO-injected embryo (supplementary material Movie 3A,B). The segmentation period of somite 4 (red bar) was longer than that of the wild-type embryo (A). (G,H) Box and whisker plots of segmentation period (G) or start to start (H) for raldh2 MO-injected embryos (n=10). raldh2 knockdown results in a prolonged segmentation period for somite 4 and the failure of proper AP transition. Results from statistical analyses are shown in supplementary material Tables S1-S4.