
Image
|
Figure Caption
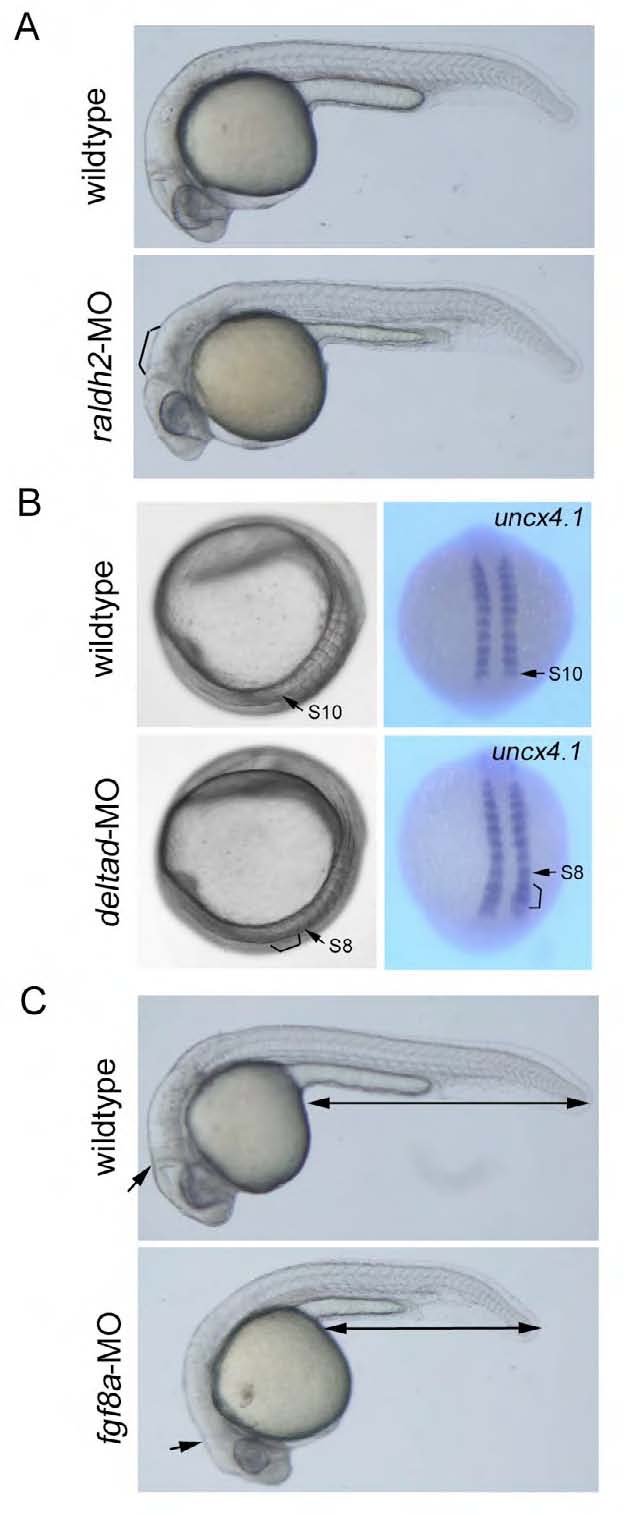
Fig. S3 Evaluation of MO activity after time-lapse imaging. (A) raldh2 morphants. Embryos (24 – 30 hpf) showing defects in hindbrain (bracket) and trunk somites were selected and used to further analyses. (B) deltad morphants. Embryos (14 hpf) which phenocopy after eight (deltad mutants) were selected. In these embryos, segmentation defects could be seen around S8 – 10 (bracket). (C) fgf8a morphants. Embryos (24 – 30 hpf) that phenocopy ace (fgf8a mutants) were selected. Defects in midbrain-hindbrain boundary (arrow) and tail elongation (double arrow) could be seen in phenocopied embryos.
Acknowledgments
This image is the copyrighted work of the attributed author or publisher, and
ZFIN has permission only to display this image to its users.
Additional permissions should be obtained from the applicable author or publisher of the image.
Full text @ Development